
I didn’t see much ink anywhere on Monday’s Census Bureau’s construction spending news for February. The reports were out there. I saw them in my Twitter feed but by Monday afternoon, there were no headlines to be found in the usual go-to business media. However I did find this fair and balanced gem on the Fox Business website in 48 point font.
US Construction Spending Rose to Nearly 11-Year High
The post, from a Reuters feed, went on to say, “The Commerce Department says construction spending rose 0.8 percent in February to the highest level since April 2006, after two months of declines.”
Those are, as usual, seasonally adjusted numbers, designed to show a smoothed, idealized version of the trend, not the pattern of the actual data. We can’t tell whether that representation bears a close semblance to reality or not unless we plot the not seasonally adjusted actual data on a graph as well. Draw a couple of trendlines, and voila, you see the actual trend in all its naked glory. So we start with the NSA data and end with it because, at best, the SA data is irrelevant. At worst, it’s misleading, and usually a couple of months late in depicting when the trend is changing direction. So why bother? Just plot the actuals.
Another problem with the reporting of the construction spending is that it’s on a nominal basis, not adjusted for inflation. To get an idea of the actual unit volume of construction, we need to convert the reported numbers to real terms. I use a Producer Price Index (PPI) for construction for that purpose.
Construction spending is a more important data point than the lack of media coverage would suggest. First, the industry is interest sensitive. Most commercial and residential construction is highly leveraged. Construction interest is a big part of the cost. So the industry is more interest sensitive than most. Second, it’s a pretty big contributor to US GDP at 4.2%, but once upon a time, it was 5.1%. Many construction workers are Don Trump’s voters. It’s a bigger cohort than just them because Trumpolyte construction workers also have families who mostly see things the same way. It’s at least symbolically important if Don Trump doesn’t make construction great again.
So first let’s take a look at how the headline SA numbers look on a chart.
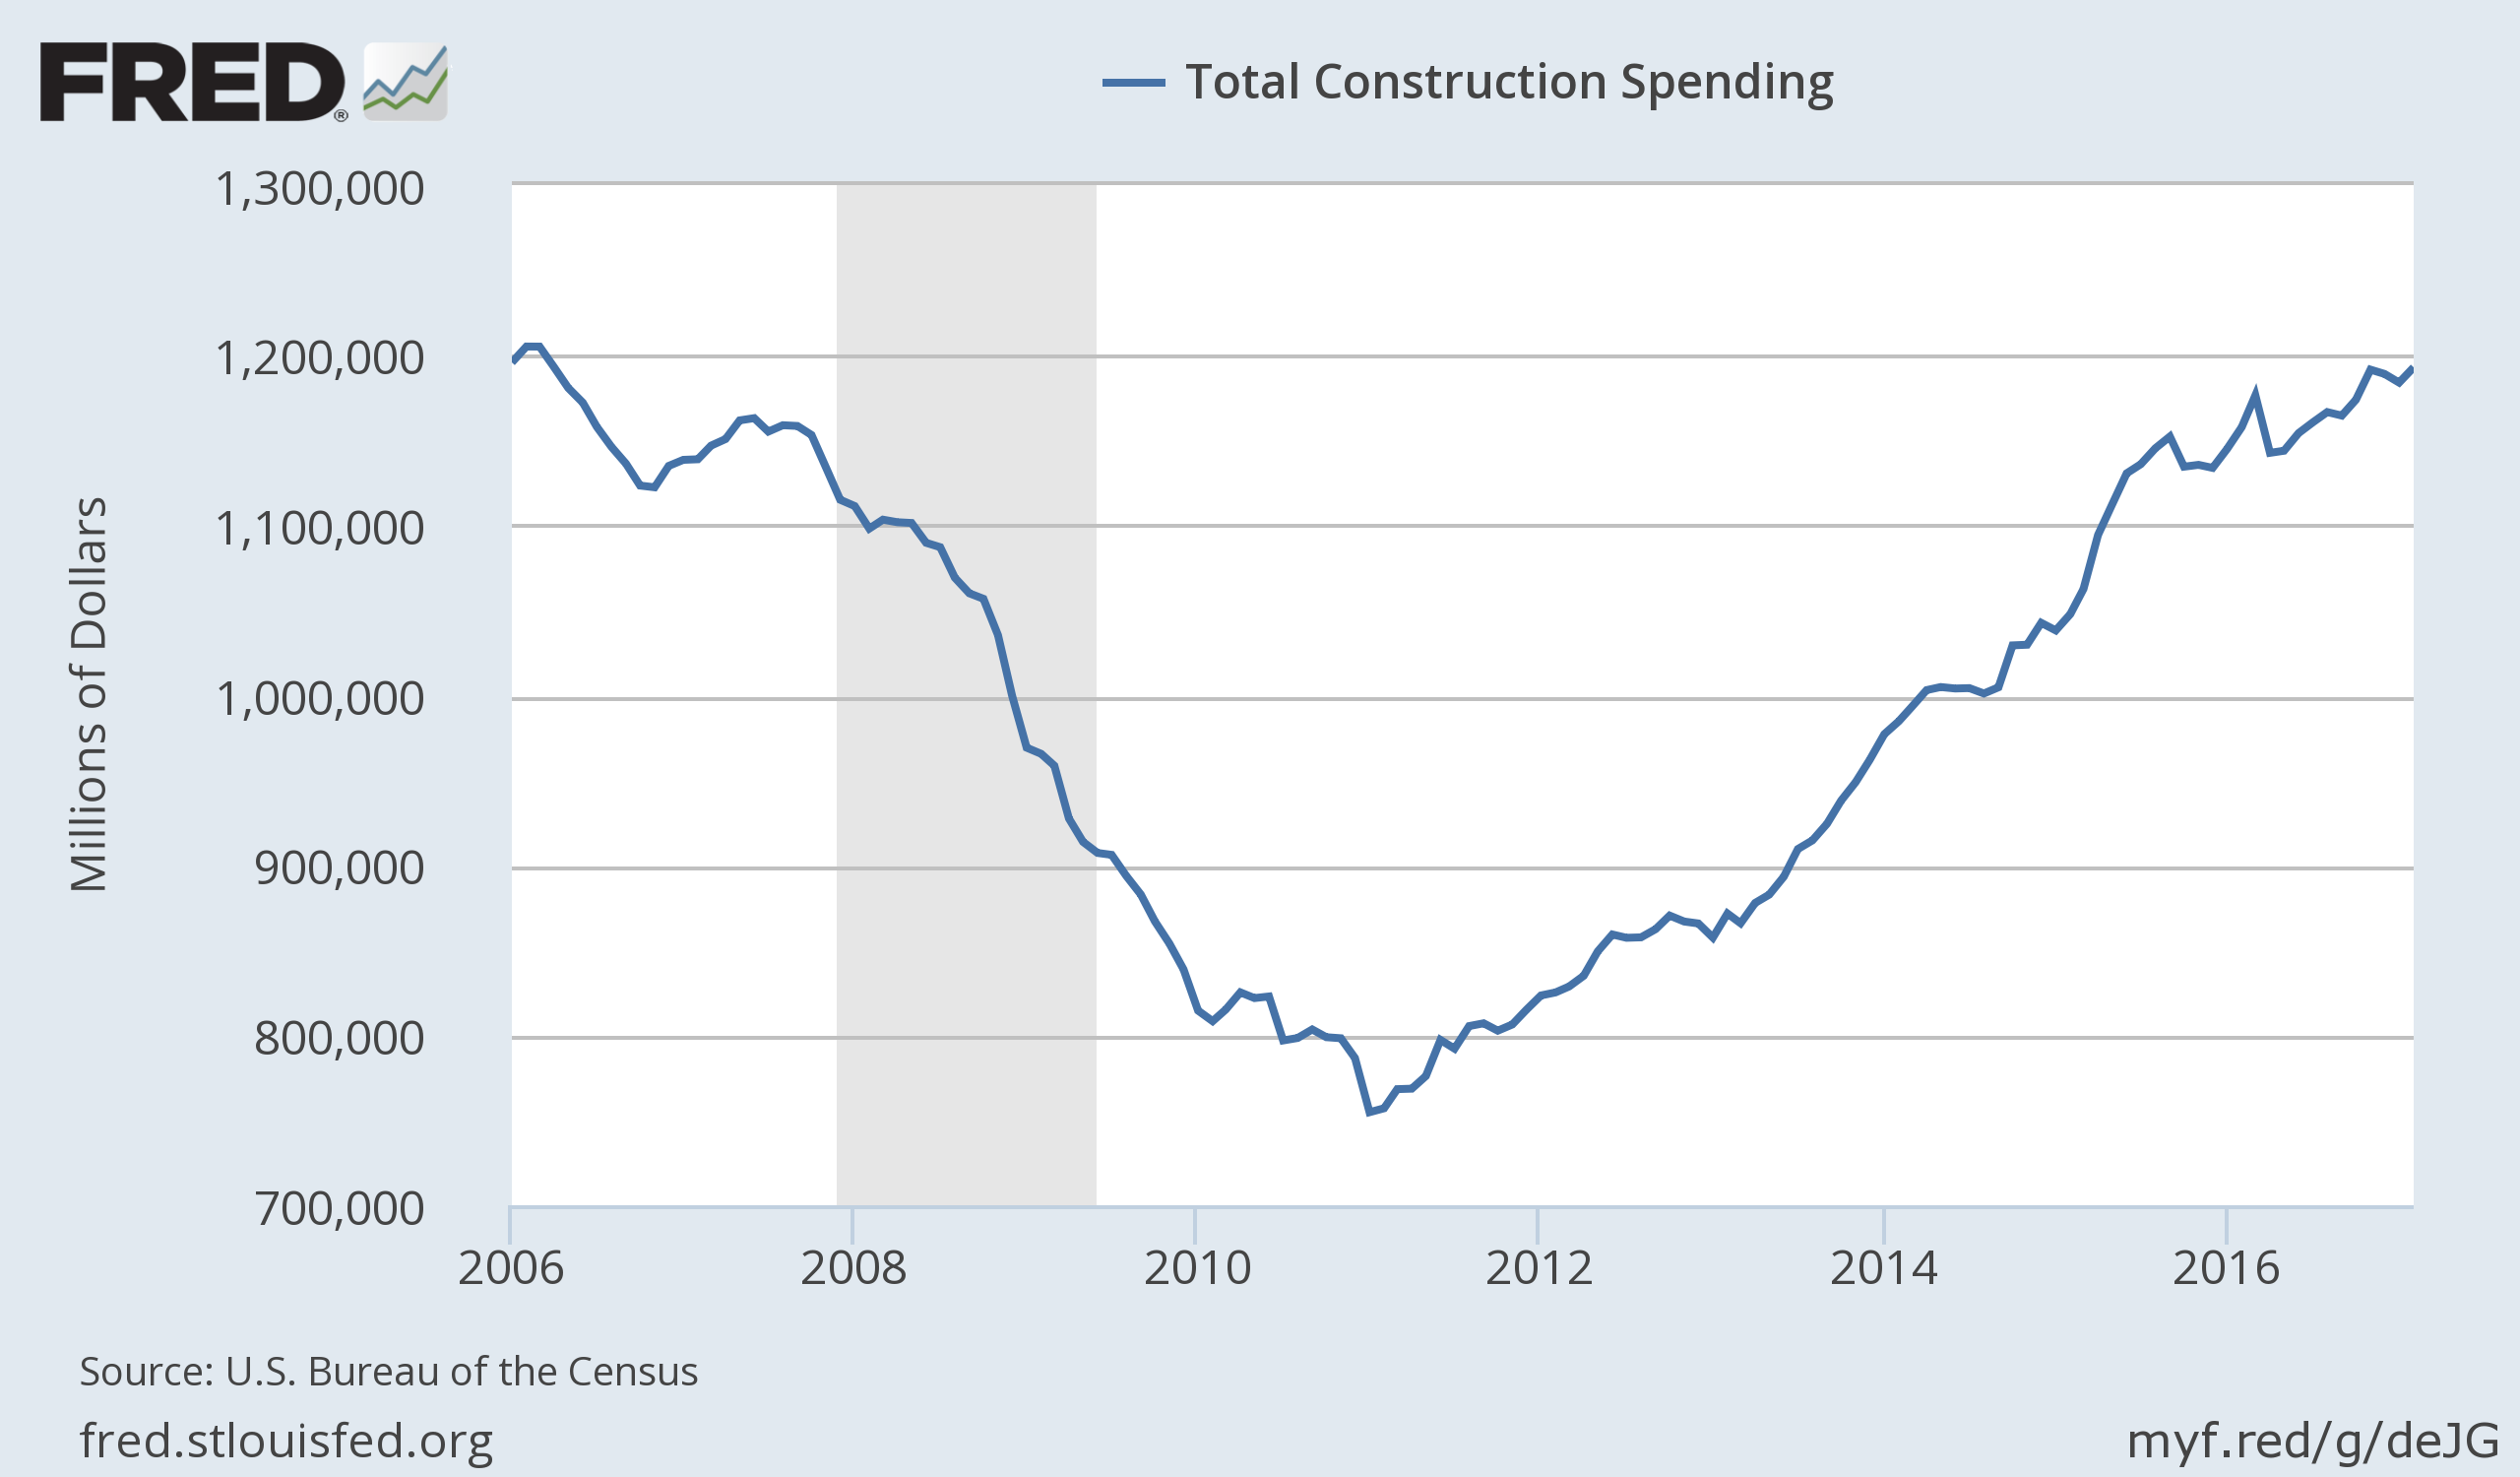
That line is pretty cool. After 5 years of recovery in construction, total spending is almost back to where it was in 2006. Whoop de doo! This includes residential, commercial, and government construction. Those are 3 different industries. We know that the recovery in residential construction, while persistent since 2011, has been historically very weak. We’ll look at commercial construction below.
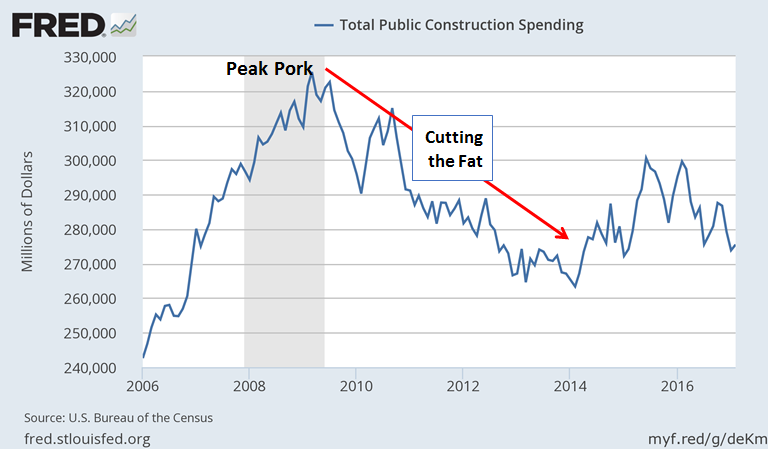
But first, there’s government construction. It isn’t really an industry. It’s an economic support program, usually a charade of constructing buildings named as monuments to living Congressman, in other words, pork. Pork currently accounts for about $275 billion of the nearly $1.2 trillion in total yearly construction spending. That’s versus $242 billion in pork spending at the beginning of 2006.
Pork spending is now higher than it was at the top of the housing bubble, but it’s lower than the $325 billion at peak pork stimulus at the bottom of the recession. Peak pork was $325 billion per year at the end of the Bush Administration.
So here’s a little politifact. During the first 6 years of the Obama Admin pork spending fell from $325 billion a year to $263 billion per year. Today’s level is about where it was in 2012. Apparently Obama managed to trim the fat from the pork. The big jump in spending came in the last 2 years of the Bush Administration. Those Republicans! Always big spenders!
It will be interesting to see if Don Trump can move the cement in the year ahead. He has plenty of skeletons to bury in those building foundations.
Meanwhile, the new 11 year high in SA nominal data for total construction spending sounds impressive until you consider that the new “record” isn’t adjusted for inflation.
Here’s how the data looks plotted on the NSA basis, in real terms, adjusted for the inflation in construction costs.
That 0.8% growth for February that the mainstream reports talked about suddenly looks a lot more like zero over the past year, after a steady decline since mid 2015. It’s down from growth rates of 4-11% between 2012 and 2017. If it quacks like a slowdown, it’s a slowdown.
This slowdown happened in spite of the benefit of record low construction loan rates. What happens when rates actually do rise? We’re probably about to find out. And it won’t make construction great again.
The volume of construction is now down 14% from the February 2007 level. If we measure greatness by the volume of construction activity at the top of the biggest bubble in US history, then rest assured, it won’t be great again. If interest rates rise, as the Fed seems to intend, it will won’t be great. It will be sad.
Last but not least, let’s consider commercial construction spending. It gives us an idea about business sentiment and the impact on long term fixed investments in office, industrial, and retail buildings. We again look at this data on an inflation adjusted basis to see the trend of construction volume.
With the help of the lowest construction loan interest rates in history, commercial construction volume increased by 3.8% over the past year. It has managed to rebound by 40% since the cycle low in 2011. As impressive as that sounds, it’s still well below the 2008 peak. Note that that peak was well after the 2006 peak of the housing bubble.
Note also that the bottom in commercial construction spending was 2 years after the recession low. Commercial projects take a few years to go from planning to building. Once they start, they rarely stop in mid construction. It happens, but it’s the exception.
So it should be of little comfort that this line is still rising. The spending we see now grew out of projects planned a year or two ago. As interest rates rise, office and industrial projects that are early in the planning stage will be killed. That’s when spending will reverse.
Meanwhile, an oversupply of commercial buildings will form. That will put pressure downward pressure on occupancy, rents, and commercial property values. If bond yields rise, so will mortgage rates, and investment real estate capitalization rates. That will be a triple whammy that will lead to a thunderous collapse in commercial property values. The next step would be an enormous wave of foreclosures and bankruptcies. A banking collapse would be a given under the circumstances.
Needless to say the transition to online shopping will constrain retail construction. And the rise in telecommuting, will reduce the need for office space. So it won’t be just the real estate boom bust cycle and rising interest rates that constrain future commercial construction. Societal secular trends will also cause commercial construction to decline over time We already see the evidence of those trends in the fact that commercial construction spending remains more than 10% below the level.
It’s not a happy picture. The bubble in commercial property REITs is headed for collapse.
Lee first reported in 2002 that Fed actions were driving US stock prices. He has tracked and reported on that relationship for his subscribers ever since. Try Lee’s groundbreaking reports on the Fed and the Monetary forces that drive market trends for 3 months risk free, with a full money back guarantee. Be in the know. Subscribe now, risk free!

