
On Monday we told you about the largest “gain in industrial production in 3 years” (wink, wink). Or at least so the Wall Street Journal said. The Journal also said that it was evidence that “economic growth is picking up.”
We analyzed the actual, not seasonally adjusted numbers against the widely reported seasonally adjusted numbers. It was clear that it wasn’t the best month in 3 years. It wasn’t even a very good month. April had 1 less weekday than in a typical month so the Fed made a big seasonal adjustment upward. The seasonal adjustment factor that they used made an assumption that factories, mines, and utilities don’t operate on the weekend, when in fact, many of them do. This is especially so for utilities, process manufacturing, and oil and gas production which are part of the mining index.
I broke the data down further to give you a clearer picture of just how the major production sectors did. This includes a separate look at Energy Production, Non-Energy Production, and a deeper dive into Electric and Gas Utilities Production.
I particularly like the last one because it’s a great proxy for the whole US economy. Utilities serve not only industrial users, but all sectors of the economy. That includes office, retail and wholesale trade, medical, educational, social, government, and of course households. Everybody uses energy produced by utilities. The rise and fall of utilities production compared to the same month in past years and on the basis of the momentum of the annual growth rate gives us a good idea of whether or not “economic growth is picking up.”
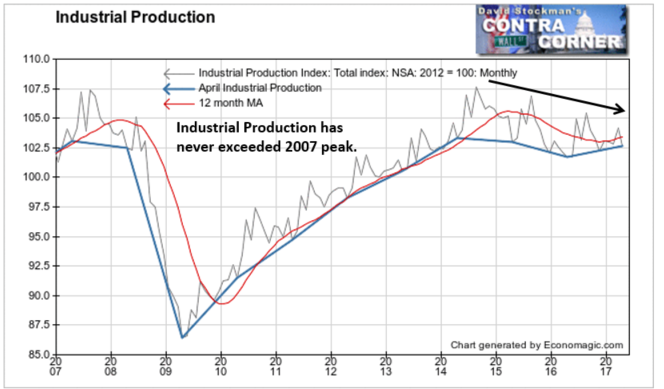
First here’s the underwhelming evidence of the total index showing growth picking up. It was a 0.9% year to year increase. The total index remains below the levels of 2015 and 2014 and still hasn’t exceeded the level of 2007, 10 years ago.
Energy Production
Energy production always falls in April, so the fact that it was down this April is not surprising. It dropped by 3.8%. The issue is how that compares with the average April. On that score, it was a little worse than average. The average change for the past 10 Aprils was -3.6%.
However, production was up 5.5% year to year, which was just a hair more than the March year to year gain of 5.3%. The gains appear to be on a par with the growth rate before the oil price crash in 2014-15. The 12 month MA has turned up. This looks like a net plus for the economy, but it’s contingent on oil prices holding up.
The annual growth rate in energy production has surged since the oil price crash bottomed late in 2015.
Non-Energy Production
This encompasses US manufacturing production and mining production excluding oil and gas. So about that vaunted pickup in economic growth? According to this index, it didn’t happen and it hasn’t been happening since 2014.
April is normally a down month, so this April’s drop of -0.7% isn’t surprising. But it still wasn’t a great month. The average decline for April is -0.6%. In fact, last April saw a gain of 0.7%. But here’s how we can tell just how punk this economy really is. The year to year change was a drop of 0.2%. That’s the worst reading since last August.
Furthermore, this index has hardly budged since 2014. The recovery clearly ended then. There’s no manufacturing recovery. It had a small rebound after the crash and now it’s just muddling along at about 7% below the production levels of 2007. It’s even still 5% below 2008 when the US was already in recession. This is a terrible performance. Yet Wall Street and the media keep talking about a manufacturing recovery. It’s a myth. There is no manufacturing recovery. There’s no evidence that the US economy is “picking up” regardless of how much the Wall Street Journal claims that it is.
Electric and Gas Utilities
This is a stat that cannot tell a lie. If the utilities aren’t producing and distributing more energy year to year, then the US economy isn’t doing well. If power generation and distribution is growing, then the US economy must really be growing. The Fed told us that Utilities production was up 0.7% in April using seasonally adjusted data. That’s hardly evidence of growth, but again there’s even less there than meets the eye.
We need less heat in April than we do in March, and we haven’t turned on the A/C yet, so April is always a down month in the actual, not seasonally adjusted data. This April saw a production drop of 12.2%. That was a little worse than the 10 year average drop of -10.2%. It was much worse than last year’s decline of -6.3%. And let’s not blame the weather. There’s been less than a 1 degree difference in the US April average temperature between April 2015 and this April.
Year to year production was down 0.5%. Does that sound like a growing economy? Looking back 6 months to October, it also showed a decline. Weaker utilities production is not a new phenomenon.
The long term chart doesn’t lie. You want growth? Look at 1990 to 2008. That’s growth. It ended in 2008. Since then there has only been stagnation. April’s numbers show that the economy has actually been weakening since 2013. The 12 month moving average says we’ve been doing worse since 2014.
The economic growth story doesn’t fly. The numbers don’t add up. But decision makers, including central bankers, CEOs and hiring managers have been acting as if they do. Being in denial typically doesn’t end well.
Lee first reported in 2002 that Fed actions were driving US stock prices. The US Treasury has also played a role in directly moving markets. Lee has tracked and reported on those relationships for his subscribers for the last 15 years, helping to identify major turning points in the markets in their earliest stages. Try Lee’s groundbreaking reports on the Fed and the Monetary forces that drive market trends for 3 months risk free, with a full money back guarantee. Be in the know. Subscribe now, risk free!

