
By Tyler Durden at ZeroHedge
Over the past three years, we have beaten the topic of soaring, record stock buybacks to a bloody pulp.
Starting in 2012, among countless other pieces on the topic, we wrote “How The Fed’s Visible Hand Is Forcing Corporate Cash Mismanagement” and “Where The Levered Corporate “Cash On The Sidelines” Is Truly Going”, i.e., buybacks“, then in 2013 with “$500 Billion In 2013 Corporate Buybacks: Half Of QE“, then again in 2014 in “Here Is The Mystery, And Completely Indiscriminate, Buyer Of Stocks In The First Quarter” and finally two days ago “It’s Not The Record High Debt That Is The Biggest Risk, It’s [the dropping cash flows]”, we have constantly explained that the primary source of stock buying over the past several years have been corporate management teams repurchasing their own shares using ever greater amounts of debt as a source of funds, in the process boosting not only their stock price but their equity-linked compensation and bonus pools.
This couldn’t go on for ever, and on Monday, Goldman which may or may not have read our prior piece “Why The Stock Buyback Spree Is Ending“, issued its own loud warning when it finally noticed that corporate debt has doubled in the past several years and said “so, does this mean the levered re-cap is dead? In our view, the answer is yes for the broad market.”
Today’s market action seems to be confirming just this.
This progression of events had been both predicted and documented on these pages.
Yet one thing that is absolutely stunning, is something which SocGen’s Andrew Lapthorne pointed out a few days ago, in a chart which compares the changes in net debt with net buyback activity.
The chart below shows something absolutely amazing: while there are clearly other fungible “sources and uses of funds”, what all the leveraging activity of the current century boils down to is the following: virtually every single dollar raised through issuance of debt has been used for one thing – to buyback stock!
To be sure, other sources and uses of cash can be comparably tracked, and this is not to say that companies haven’t used their own organic cash creation, declining as it may be, for other purposes such as spending on CapEx and M&A, but the chart does show that in isolation from all other sources and uses of funds, several trillion in fungible debt has had just one simple use – to boost stock prices, and to make management teams richer, while letting bondholders managing other people’s money foot the bill for record high management bonuses and stock prices.
Behold – what all the debt issued in the 21st century (and really ever since 1990) has been used for:
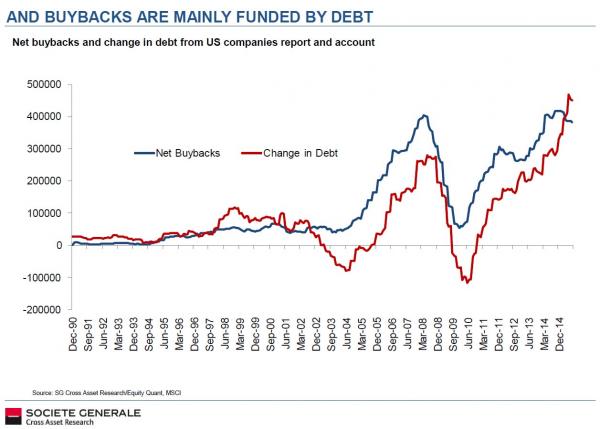
And the punchline: buybacks are finally starting to drop… but debt just soared to new all time highs.
Source: The Amazing Chart Showing What All the Debt Issued This Century Has Been Used For – ZeroHedge

