
The function of recession is not just some negative numbers that appear from seemingly nowhere, though that is how convention sees it of “unforeseeable” trends and “shocks. It may take the NBER years in some cases to declare, officially, a cycle peak but that doesn’t mean there aren’t warning signs much closer to the event. Among them is, again, not just negative numbers but the accumulation of them in closer sequence and then among a broadening range of data points. But perhaps the clincher is the eventual quickening, or deceleration.
There was serious deceleration back in the early to middle part of 2012, but instead of leading into the V-shaped contraction that usually marks recession there was a rather curious gentleness that eventually came out of it. In other words, rather than falling into traditional recession right then and there, the US economy in full partnership with the global economy charted still a downward slope but one that was almost imperceptible by orthodox definitions.
Upon closer examination, this was not the first time this weirdness had arisen; the period just prior to the Great Recession shows exactly the same pattern. Even the first “half” of the Great Recession itself, since the NBER declared the official cycle peak at December 2007, does not look anything like the second half. That raises the intriguing possibility about whether recession itself is defined and understood well enough (a topic for another day).
This would seem to change the definition of “cycle” to a more modern conception, as clearly cycles have been altered dramatically going back to the 1990-91 recession. We know full well about the “recovery” part, just ask George H.W. Bush, and the sudden appearance of “jobless recoveries” that have been featured prominently in each of the three since. Furthermore, violating all sense of symmetry and Friedman’s “plucking models”, recoveries have grown more and more sluggish without relation to the size of the recession that preceded it – this recovery has been the worst when it should have been the sharpest and most affirming given the size of the contraction.
The most obvious culprit has been the altered state of finance itself. Alan Greenspan took the method of interest rate targeting to mean general control of economic function but most especially as it related to the business cycle. It might be mere coincidence that the recovery aspect changed as did monetary policy, but the further history of business cycle behavior argues very strongly otherwise.
Introducing interest rate targeting also opened the door, as the conditions were intentionally ripened anyway, for the supplanting of the dollar by the “dollar.” The year 1995 figures prominently in almost every measure of bubble behavior. Therein lies a great deal of the answer about what it is that may be altering the business cycle, changing the character of not just the recovery (financializing it further and further away from productive, and thus efficient, business and personal activity) but also the peak.
If that is indeed the case, then there might be, as in the Great Recession, a double peak of sorts; the first denoting the initial slide into gentle deceleration or attrition and the second more like the traditional idea of a peak. I have little doubt we passed the former sometime in 2012 – it shows up in every single economic account (including GDP before the massive July 2014 revisions) save the unemployment rate (though the labor force and Household Survey dip right at October 2012). The accumulation of data so far in 2015 has lent to suggestions of a rising probability of the second peak.
Again, it isn’t just negative numbers but the amassing of them and the speed at which they are attained:
Corporate America’s profit engine may be running out of steam. Wall Street analysts, expecting two quarters of declining earnings, are banking on a second-half recovery to keep 2015 from becoming the worst year for profits since the last recession.
But with U.S. crude holding below $50 a barrel and the dollar at 12-year highs against the euro, even those bets may be optimistic.
At the outset of 2015, analysts were figuring S&P 500 EPS at +8.1%, meaning that profit estimates have come down quickly not just for Q1 but for the entire year. Worse, as quoted above, the current estimate of +1.7% is backloaded.
If profit across the board comes in at 1.7 percent higher [sic], 2015 would the [sic] worst year for companies in the S&P 500 index since 2009, when earnings fell 5.5 percent.
Profit estimates for the first and second quarters already are in negative territory, with analysts expecting them to decline 2.7 percent and 0.1 percent respectively, the data shows.
It should be noted, but never is, that when earnings fell 5.5% in 2009 a great proportion of that was not just the Great Recession but how collapsing energy prices and a “rising dollar” perpetuated the negative cycling of contractionary behavior. That is the great concern of equity prices, as there is clearly a divergence yet again in terms of these potential “peaks.”
If you search back to 2012, stock prices decoupled from economic fundamentals which is made obvious by the comparison to commodity prices.
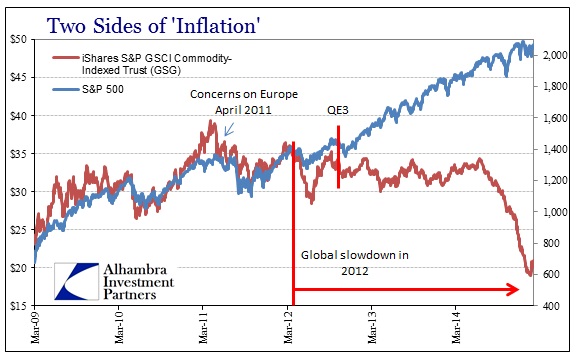
Right as the first “peak” was showing, commodity prices stopped advancing while stock prices began to move almost exclusively on valuation expansion. Again, it may be mere coincidence surrounding the timing of the introduction of QE3 and then QE4, but the diverging trajectories more than suggest that if either QE had an effect it was more stock prices and much less economy. And the collapse in commodity prices starting with the rising “dollar” and the broader sense of credit indications that the second peak may be approaching has been met with a further divergence within stocks themselves.
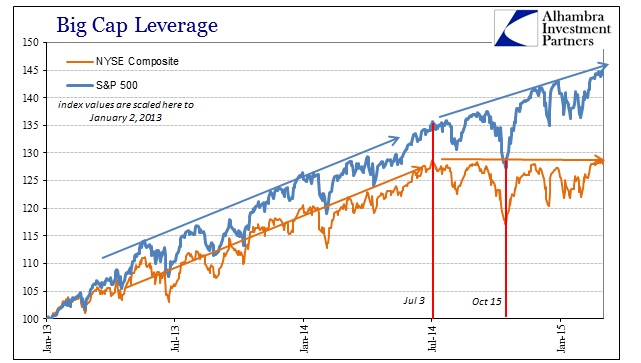
That has left only the larger caps twisting into the winds of the “dollar”, rising single-handedly via the very share repurchases that have marked this disassociation of traditional business cycle mechanics the most. That means bubbles themselves produce less and less actual though artificial economic growth even in the short run. That would explain why, in good part, there have been four QE’s just in this “cycle” alone.
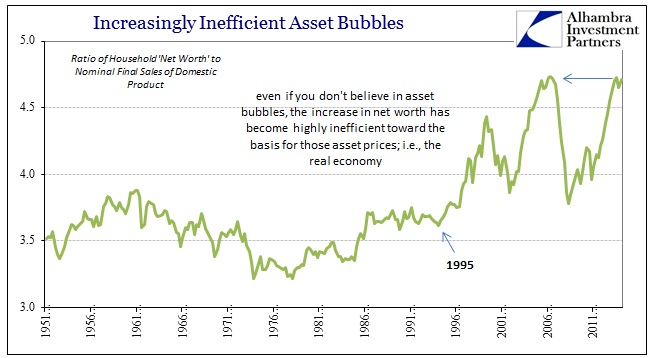
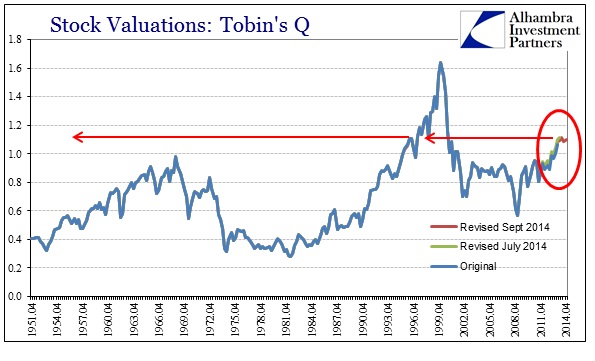
With the release of the formerly Flow of Funds (still Z1) for Q4 2014, we can update valuation metrics for these bubbles. I prefer the broad measure of total household net worth compared to final sales of domestic product because it distills all the essences of not just bubbles but I think the relationship of the elongated cycling to them. Total household net worth includes both stocks and housing, while final sales does not include some of the artificiality of GDP as a whole, instead focusing on simply “demand.”
However, it really doesn’t much matter at this point as every other major valuation technique shows debasement already above the 2007 peak and only in comparison with the worst levels of the dot-com bubble.
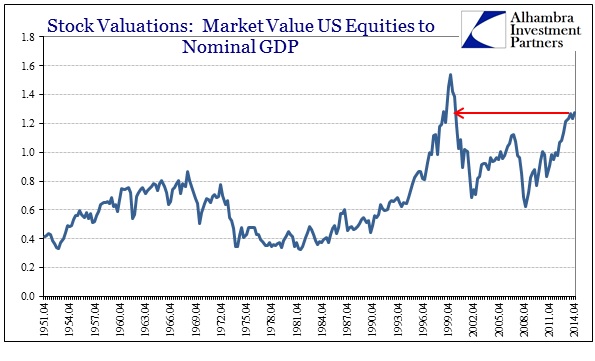
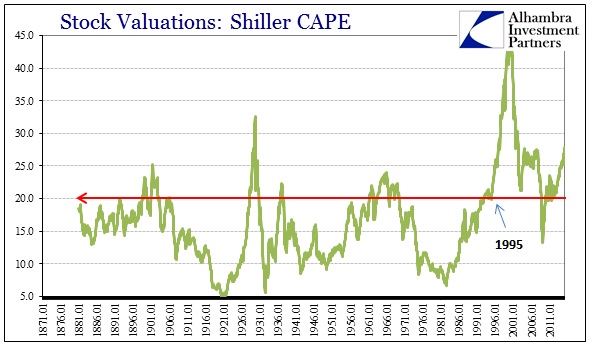
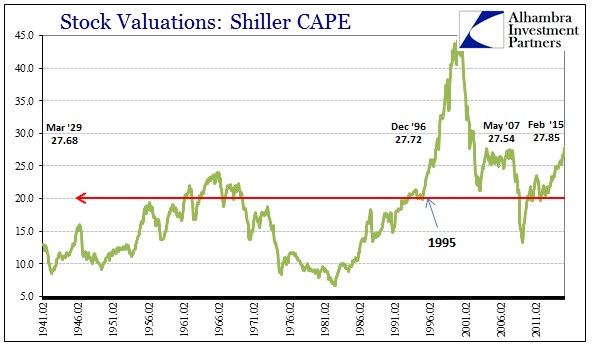
Robert Shiller’s Cyclically-Adjusted PE (CAPE) is the last of these valuation techniques to rise above the prior (2007) cycle. By way of comparison, that is the same valuation level as March 1929!
While valuations don’t tell us much about how the “market” will behave going forward, they do suggest, highly, what to expect over the next decade or so.
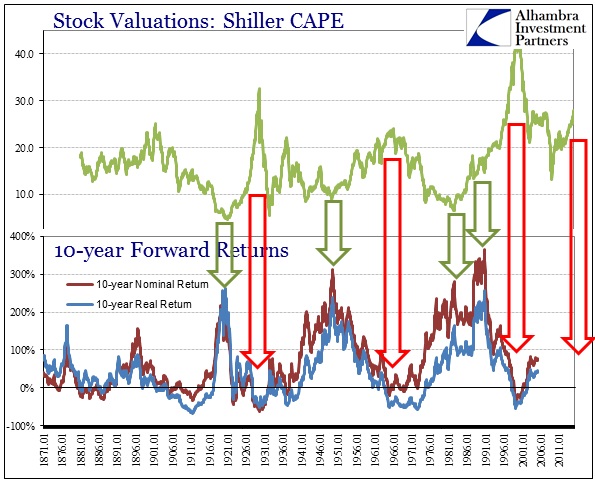
I think that may be the relevant combination, as extremely high valuations do not combine well with changes in the cycle especially under these new business cycle processes. That was the immediate catalyst for both of the last bubbles bursting – unless that too is just coincidence.
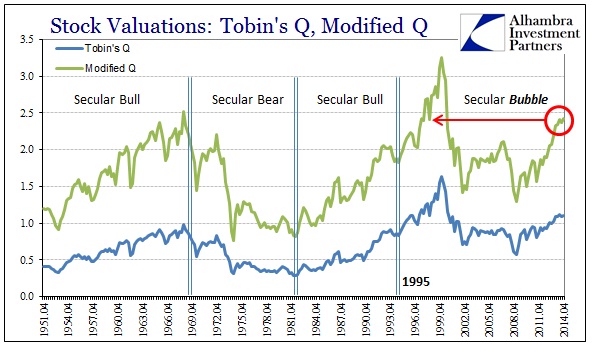
NOTE: the “modified” Q above takes Tobin’s Q and subtracts corporate real estate at market value from corporate net worth. The intent is to remove any potential bubble in real estate from “justifying” valuations in corporate equities.

