
Yesterday we looked at the idea that the Fed’s balance sheet (BS) is in the calm before the storm. I briefly touched on the fact that banking indicators are in a similar place. Not much is happening right now, but the storm is just over the horizon.
The storm will start when the Fed actually begins shrinking its assets, probably some time later this year. Several Primary Dealer/banks have speculated publicly that the process will begin in September. They should know. They talk to the NY Fed’s trading department all day every day. There’s no information on how often they talk to the FOMC members themselves, but it’s probably safe to guess, “a lot.” So they should know.
Meanwhile, here’s a look at the banking indicators and a few other indicators that have been flashing caution signals and that could signal when the trouble is really starting.
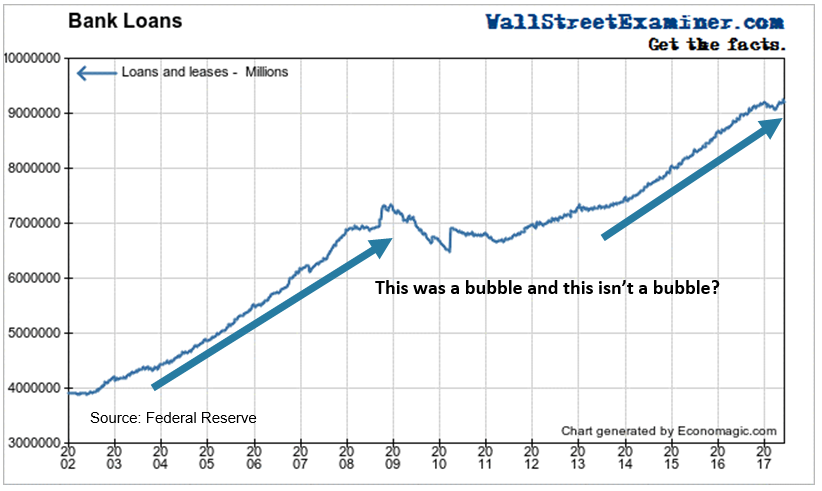
Bank Loans Outstanding
Bank loans rose in the 4 weeks ended June 7. They reached a new all-time high at the end of May, before a slight decline in the first week of June. The annual growth rate edged lower to 3.6% versus 3.8% a month before. It’s down from 6% in December 2016 and from a peak growth rate of 8.5% in early 2015.
Some of the increase in debt that had driven the economy and the asset bubbles has bled off. With the Fed announcing that it will reduce its balance sheet, that’s likely to deter speculative borrowing even more. The bull market has been driven by free and easy credit. The free part is going away. The easy part is about to. The direction of this line over the next few months could render an important signal for the stock market.
Lending not related to financing securities holdings includes both consumer lending and commercial and industrial lending, but excludes securities financing. These loans rose over the past 4 weeks.
The annual growth continued slowing dramatically. Even after this month’s uptick to a new high, the growth rate has dropped to 3.9% from nearly 8.5% in mid year 2016. A month ago, the growth rate was 4.4%.
The current growth rate is still greater than the growth rate of the economy. But the rate and persistence of the slowdown is greater than any decline since the recession bottomed in 2009.
Growth has slowed but the bubble is still with us. The zombie walks. It’s alive. But this could be its last gasp. 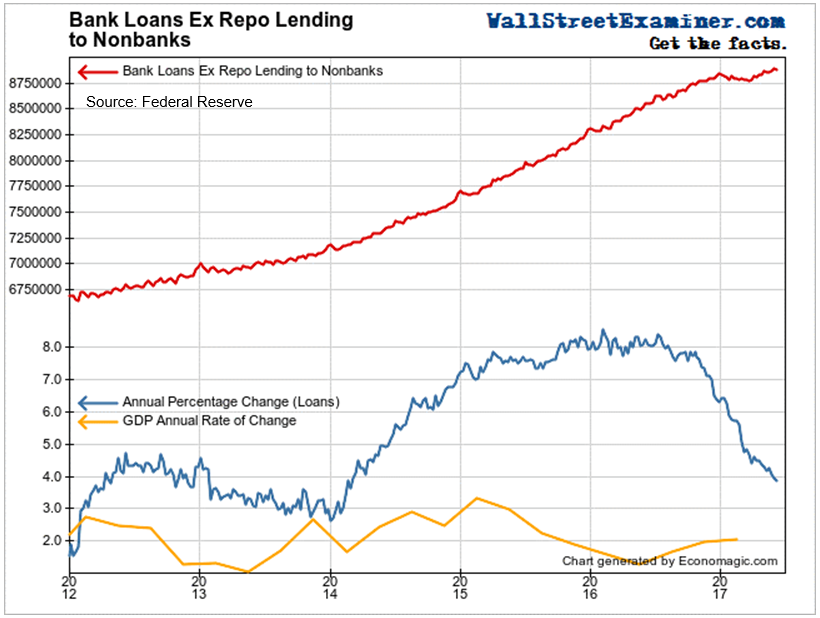
Bank Loan Loss Reserves
Banks’ loan loss reserves reached another post crisis record low as a percentage of loans outstanding over the past 4 weeks, even as the ratio upticked in the first week of June. The banks even had even cut total loss reserves since the end of 2016. That took them to a new low at the end of May before bouncing back in early June. This is just another symptom of the steadily building systemic risk inherent in bubble behavior. Imprudent behavior goes hand in hand with confidence increasing to the point of irrationality.
As loans outstanding have soared and GDP growth has slowed, you would think that bankers might recognize the increasing risk and set aside a bit more in reserves. But they haven’t seen it that way. 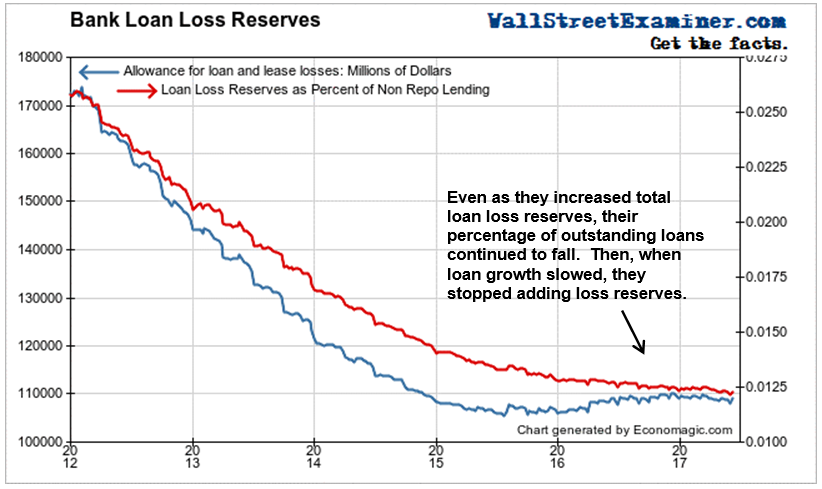
Commercial and Industrial Lending
Commercial and Industrial Loans slipped in the 4 weeks ended June 7. The annual growth rate is collapsing, now down to just 2%, from 6% in January. The growth rate peaked at more than 13% in early 2015.
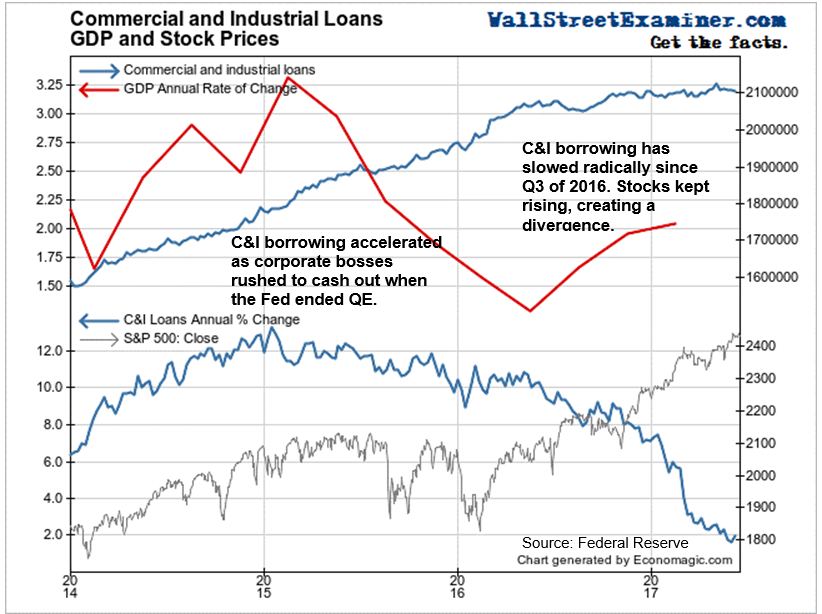
I noted back in March that the sharp slowdown in C&I loans suggested that corporate borrowers had all but stopped doing buybacks and other financial engineering deals. That suggested that the stock market rally was running on fumes.
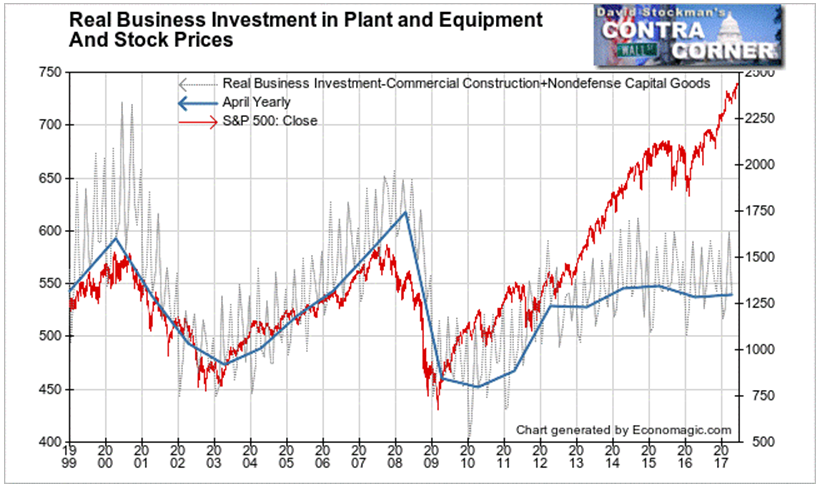
Real Business Investment
Meanwhile, as the stock market barreled higher, real business investment in plant and equipment stalled. Bankers may have been confident in their prospects, but the biggest customers of the banks apparently were not. Businesses essentially stopped growing their investments in tangible assets in 2015.
Note that the stall coincided with the end of QE at the end of 2014. With the Fed soon to begin balance sheet “normalization,” this stall could turn into outright decline. The negative divergence between stock prices and real investment would expand, signaling ever greater risk for stocks.
The C&I Loan growth rate has slowed but is still extremely high in relation to fixed investment. That funding continues to buttress the stock market bubble.
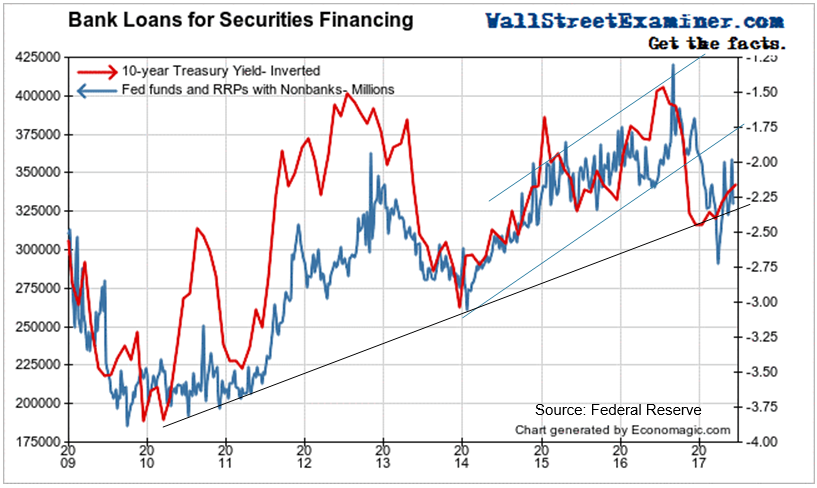
Repo loans to nonbanks to finance carry trades and other securities rebounded over the 4 weeks ended June 7. However they remain in a short term uptrend off the bottom of the crash that began last September.
The current short term rally in Treasuries led the recent rise in repo lending. Hedge funds and other nonbank trading firms seem to have the trend-following bug. The rise and fall in this measure seems to either lag or be coincident with the market.
The rally is a gift for holders of long term paper. The Fed is about to begin real tightening. That will raise bond yields as the Treasury increases supply to raise the cash to redeem the bonds the Fed holds.
In addition, a massive increase in Treasury supply is coming when the debt ceiling is raised. By the time that happens, the Treasury will have borrowed a couple hundred billion from government pension funds and other internal funds. It must pay those back, and it will do it quickly. With this double whammy coming, the bond market is probably headed for a very severe decline in prices, maybe even a crash, at some point this fall.
So it’s time to get out, or at least dramatically shorten maturities. The market is giving bond traders every opportunity to do so.
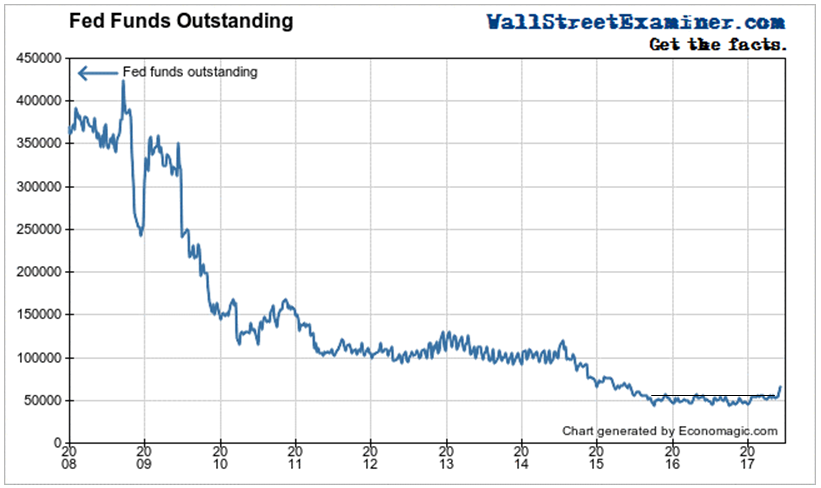
Fed Funds Outstanding
With the banking system awash in excess reserves, healthy banks do not need to borrow overnight Fed Funds from one another to meet reserve requirements. Only the most distressed banks have been in the market at all over the last several years. But the amount of Fed Funds outstanding had a breakout from their range of the past year and a half, in early June. This could be a sign of increasing systemic stress or it could be just a false alarm. If that’s the case, total outstandings will drop back to where they were. But if this is the start of a new uptrend it could be a sign of big trouble brewing. We’ll should know over the next couple of months, depending on how this data behaves.
Money Supply
Money supply growth was little changed in the 4 weeks through June 7. When the Fed begins shrinking its bond holdings later this year, money supply growth will slow, and may even turn negative as the Fed reaches $50 billion a month in reductions 12 months from the start of the “normalization” process.
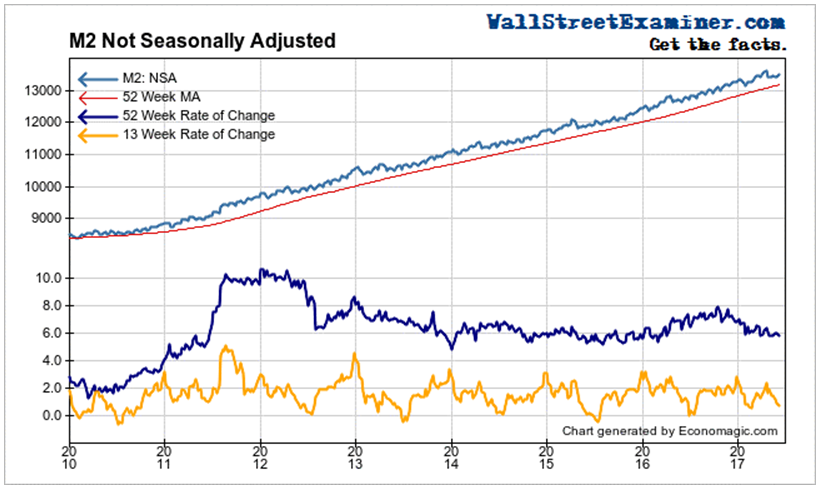
Meanwhile, money supply continues to grow at 3 times the rate of economic growth. That excess money comes from both domestic loan growth and from inflows from the rest of the world. Those in turn are driven by the ongoing money printing programs in Japan and Europe.
When we begin to see the growth of M2 slow, we’ll know that the jig is up.
This period of quiet is when you should begin your evacuation. An orderly withdrawal is better than forced retreat. Because that’s what it will become. The Fed will start by shedding $10 billion a month, which is no big deal, but it is planning to go to $50 billion a month in 12 months from the beginning of the program. That is a big deal. My bet is that it will cause a bear market in both bonds and stocks.

