The Case Shiller index of the 3 month average of April, May, June and some July sales was reported today. I won’t insult you by repeating the mainstream media reports on this number. Does the media report the April-July 3 month average price of the S&P 500? today? Of course not. It’s meaningless.
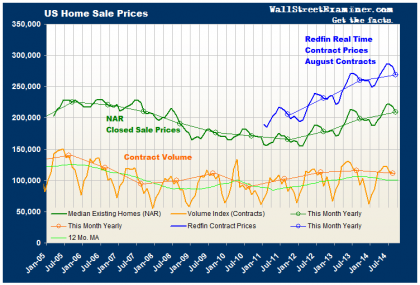
Several housing price indicators come much closer to the mark in reporting more current market levels and trends. These include the NAR’s report of their closed sales in September. Even that has a lag of 2-3 months from the contract date by the time it’s reported in late October. More timely is Redfin’s report of current contract sales prices for September, which only lags real time by 6 weeks or so.
Looking at September real time prices and trends is a lot better than the ridiculously lagged and smoothed Case Shiller index. I mean, for goodness sakes, it’s almost November! Why should we care where the market was in May?
The Realtor’s measure of September closed sales was down 4% month to month and up 5.6% year to year. There’s always a price decline from August to September. The 4% drop this year was less than the 5.3% drop in September 2013, and more than the 3.6% drop in September 2012. This year’s September drop was unremarkable. This data would typically pertain to properties that went under contract in July with some from August.
The month to month change did not suggest a material slowing in the housing inflation rate and the year to year increase of 5.6% was the strongest year to year change since March. However, this year’s increases are slower than they were last year when they hit double digits. But that’s history. The last 3 months in the NAR data showed an increase in year to year momentum, going from +3.7% to +5.1% . Is housing inflation starting to rise again?
The answer is “probably not.” Online real estate broker Redfin now reports real time contract prices in 38 US metros from data it collects from the local MLS in each market. These markets tend to be the best in the country, so that price levels are higher than the median for the US as a whole, but the direction of the trend is representative of the entire US. This is the closest data we have to showing us where the market is right now. It showed a month to month drop of 4.4% in September. Again, September contract prices normally show a decline from August. However, the current data was weaker than September 2013, which was down 3.2% and much weaker than September 2012 when the drop was only 2.1%.
The year to year change in September was a gain of 3.4%. Not only was that weaker than the NAR’s closed sales data annual rate of change from September, but it represented a continuation of a slowing inflation rate in Redfin’s data throughout 2014. Redfin’s data is the most current contract data available, and it suggests that as of September, housing inflation was slowing.
The graph at the bottom of the chart shows weakening sales volume. That suggests weakening demand, hence the slowing of price increases.


