
The Wall Street Journal reported today that existing home sales, “rose in October for the second straight month to a new cyclical high despite rising prices and shrinking inventory, a sign housing demand remains buoyant as the year comes to a close.” [emphasis mine]
The headline was less cautious.
U.S. Existing-Home Sales Highest Since February 2007
Housing demand remains resilient despite rising prices and shrinking inventory
It reported that:
October’s sales of previously owned homes rose 2.0% over the month to a seasonally adjusted annual rate of 5.60 million, the National Association of Realtors said Tuesday, the strongest pace since February 2007. Sales of previously owned homes in October were up 5.9% from a year earlier. [emphasis mine]
Keep those phrases that I’ve emphasized in the forefront of your mind. There’s a problem with them. I will explain why, and why that’s important to you to know.
The Wall Street Journal is a service of Dow Jones. The parent company of Dow Jones is Rupert Murdoch’s News Corp. Dow Jones is an affiliate of Move Inc. That outfit is the online marketing arm of the National Association of Realtors (NAR). It runs the NAR’s nationwide listings site, Realtor.com, and performs other marketing functions for the NAR. Dow Jones and the NAR may not be joined at the hip, but they are close cousins in an intermarried family.
Dow Jones and the Wall Street Journal are also affiliates of News Corp’s News America Marketing, whose slogan is “Your marketing objectives are our business.” These facts may give you the impression that The Wall Street Journal’s reporting of the NAR press release on existing home sales. You may think that this isn’t exactly an unbiased news report, but instead is just direct marketing for NAR. You might be correct in that conclusion.
The point is, “Beware!” And beware of any Wall Street Journal news report about the economy. Because News Corp. is first and foremost an entertainment and marketing company. The businesses that they report on are either their clients, or potential clients. They slant their reporting accordingly. I pick on Dow Jones because it is the leader in the field. Other mainstream financial media organizations are of the same ilk, although Dow Jones and CNBC are clearly the biggest marketers.
The Journal’s headline and the report on existing home sales refer strictly to the seasonally adjusted (SA) data. Seasonal adjustment is poorly supported statistical manipulation. It compares the actual data with where the statisticians think the actual data would be if it weren’t for seasonal fluctuations.
Seasonal fluctuations are repetitive patterns. However, they vary in size from year to year. And they may behave differently during growth years than during recession years.
Therefore, the seasonal adjustment often leads to a misleading representation of the market in any given month. The actual data may contain anomalies or statistical error. In these reports the statisticians multiply whatever error is contained in the seasonal monthly number by 12.
The obvious thing to do would be to use the actual data and analyze that. The government publishes the actual, not seasonally adjusted (NSA) data, but no one in the mainstream financial PR mills like the Wall Street Journal reports it. It’s too easy, and it would put the statisticians out of a job. They would be replaced by lowly chartists who know how to look at fluctuating data and draw straight lines to depict the trend.
In fact this is something that you could do at home. You just need the right charts. I’ll provide them for you in my posts here, but you can also get them at the St. Louis Fed’s FRED database when you want to look up something that we haven’t touched on here recently. Just search for the data that you want to chart, and add NSA to the chart. That means Not Seasonally Adjusted.
If you have never used FRED before, just play with it for awhile. It may seem like rocket science at first. But if you are a normal intelligent person, your curiosity will be aroused. It won’t take long to become proficient. Once you do, you’ll be able to play the role of Wall Street Analyst, right in the comfort of your own home in your slippers and pajamas. And you will do it better than any Wall Street talking head trying to get you to do something that isn’t good for you.
Experienced technical analysts can take that a few steps further by using a few simple math tools. They can draw clear pictures for you of how the numbers are or are not deviating from the trend.
This gives you the ability to see the trend accurately, and most importantly get a jump on the market when trends are in the process of reversing. Reversals take time, and there is almost always some warning before the markets and the economy start sinking into the mire.
So be prepared. Follow the charts. Better yet, let us do it for you. We’ll keep you ahead of the game to keep the casino from constantly skimming your hard earned capital.
The actual NSA data on existing homes sales showed that the year to year growth rate was 0.5%. That’s not very good. It’s really no growth at all because it’s half the rate of population growth. It’s also way less than the 5.9% growth reported in the NAR and Dow Jones press releases.
Granted, this October had one less business day than October 2015. That may or may not have made a difference. On a percentage basis one less day would equate to 4.5% less time to close sales. Add that back to the actual 0.5% gain. It only adds up to 4.9% growth. The NAR reported 5.9%. The NAR was a little clumsy with its arithmetic. Even 4.9% may overstate things. In months with fewer business days, there are often more settlements toward the end of the month than in months with an extra day.
Actual October sales totaled 446,000. That’s the real number before the statisticians massaged the data into a seasonal horror show. That was 40,000 units LESS than September, which by my math isn’t a 2% gain month to month. It’s about a 9% decline.
Is that as bad as it sounds?
In the prior 10 years October had no seasonal pattern. Sometimes it was up from September, sometimes down. However, one thing is certain. October never had a sales decline of 40,000 homes from September. Even during the crash of 2007-09, it never got that bad. Not once.
This chart shows October sales since the top of the housing bubble. The rebound in sales began in 2010 and ramped up a total of 38% until 2013. That was 3 years.
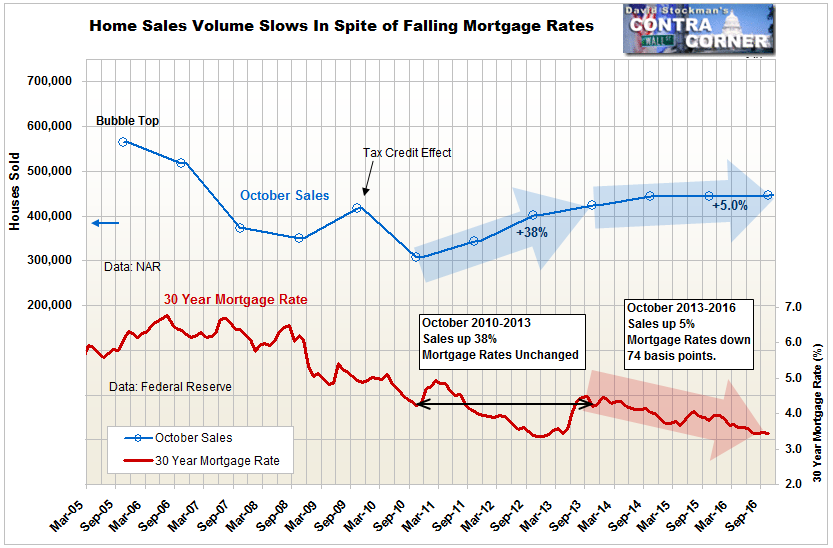
What happened in the next 3 years until last month? Sales growth slowed to a crawl, growing only 5% total since October 2013. Over the last 2 years, there has been virtually no growth in spite of two years of growing population.
The Wall Street Journal told you that sales were up 5.9% in the last year and that demand is buoyant. That’s the story from the perspective of one of the greatest marketing machines in the history of the world. The truth is, the fact is, that the market for existing homes has reached stall speed and there is no reason to expect it to regain thrust.
This condition developed in spite of a strong tailwind from mortgage rates. They dropped 74 basis in the 3 years. The market had no growth even with that tailwind.
What happens now with mortgage rates rising? They were at 3.47% in October. They’re now at 4.25% and they’re lagging the rise in the 10 year bond yield by about 25 basis points. With a normal spread, the mortgage rate should already be 4.5%. It won’t be long until it gets there. Holy cow! I can’t wait to see the sales numbers for November.
This is a bad omen. The headline writers and publicity flaks in the mainstream media got it dead wrong. October sales weren’t good. They were terrible. Demand isn’t resilient. It’s dead.
You need to know that the narrative they are feeding you is false. This happens in the final stages of a stock market bubble too. The rally is based on a false narrative, or many false narratives. The story that sales are strong and demand is resilient is one of those false narratives. This is the time to start at least a phased withdrawal from the market.
I’m not about to tell you to sell your home. It is, after all, your home, not an investment. But if you were considering selling, this is probably the last good opportunity to do it. Take the money and run. And if you notice that your local market has already slowed down, take your asking price down to a level where you can undercut the competition.
Lee Adler first reported in 2002 that Fed actions were driving US stock prices. He has tracked and reported on that relationship for his subscribers ever since. Try Lee’s groundbreaking reports on the Fed and the forces that drive Macro Liquidity for 3 months risk free, with a full money back guarantee.

