
Portions of this report have been reposted from last month’s postings on this data. All data and charts are updated.
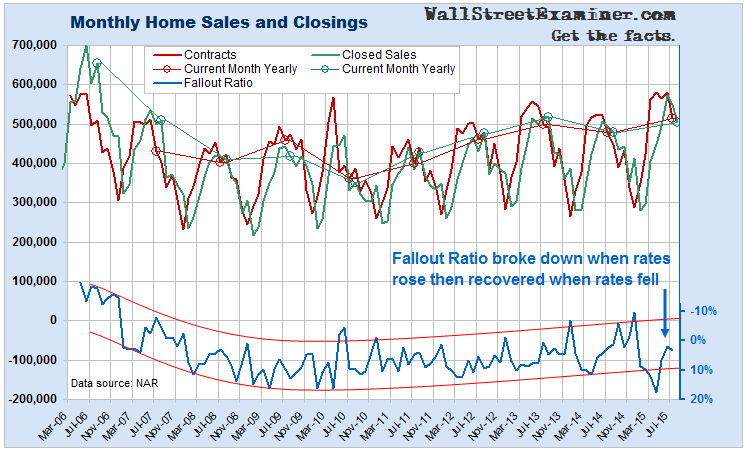
NAR data on housing sales showed the largest August decline since 1999, the earliest publicly available data. Annual sales volume growth fell to +5.4%, down from red hot gains of +11.5% in July and +13% in June. Total sales volume in July was the heaviest for that month since the peak of the housing bubble in 2005. August volume of 505,000 closings was just below the recovery peak of 518,000 set in August 2013. On an absolute level it’s still a strong number, but the two things that stand out are the size of the month to month decline, and that sales are no longer at the peak level.
The Wall Street Journal and other Big Media outlets reported a 4.8% month to month decline, using the monthly seasonal adjustment error annualized. This was below the Wall Street economist crowd consensus guesstimate of a 1.1% drop. In fact, using actual, not seasonally adjusted data, August sales fell by 8.4% or 46,000 units. It is not unheard of for sales to decline in August. It has happened six times since 1999, but this was the worst August drop since the data began being reported in 1999. This was on the heels of the second worst July month to month performance since the housing crash.
This number is a report of the number of closings in August of houses sold by Realtors. It reflects mostly July contracts, which the Realtors report as the data called Pending Home Sales. The drop in August closings was slightly larger than the drop in July contracts. As a result of the drop the contract fallout rate increased slightly, but it is still within the normal range with no sign of market distress for those months.
Click here to view chart if reading in email.
The fact that sales are slowing from bubble levels could be an early warning that the current version of the housing bubble is peaking. As house prices inflate and household incomes stagnate, affordability issues are beginning to have an impact in many markets. The market can ill afford any increase in mortgage rates. We saw evidence of that when the contract fallout rate spiked in April when rates briefly shot higher before settling back in ensuing months. Another rise in rates that sticks should be marked by another sharp increase in sales contracts that fail to go to closing. The market hasn’t had to cope with that in the last 5 months, and the Fed seemed to step away from ever raising rates this week.
In housing, volume precedes price. At the top of the housing bubble, sales volume peaked in 2005. As demand dried up and sales volume began to tank, prices peaked in most markets in 2006. The price crash began in 2007 as demand continued to fall.
With demand still high, there’s probably still time left in this market before it becomes essential to sell your house if it is you intention to move within the foreseeable future. But if mortgage rates should rise quickly at any time, the market could simply dry up, and you will be unable to sell at current prices. In the housing bubble of 10 years ago, while prices did not begin to decline until 2007, after 2005 it became increasingly difficult to sell. The market had dried up.
This is a dangerous situation given the potential for rates to rise. Artificially depressed interest rates not only cause demand to increase above what it would be if the Fed allowed the money market to function normally, they also suppress supply. Normally as homeowners near retirement or become empty nesters, many would cash out their house and invest the cash for retirement income, either downsizing to a retirement home in Florida, or renting. Now, without the opportunity to earn a decent cash return on the funds, many owners opt to either stay put, or to rent out their properties for income rather than cash out.
For that reason, a material rise in rates would be a double barreled problem. It would adversely affect demand, forcing buyers to lower their bids or stay out of the market altogether. And it would induce more supply as the huge baby boom population cohort would see more incentive to sell and cash out if there was sufficient interest income available in the market.
If and when rates rise, prices could drop sharply just as they did in 2007-2010. This would destroy housing finance collateral values again and add to the woes of a financial system already strained on the recent disappearance of fictitious collateral value in commodities and in stock markets around the world. With debt no longer backed by adequate collateral value, another financial crisis would be upon us, and cash, as unappealing as it is at near 0% money rates, will once again be king.
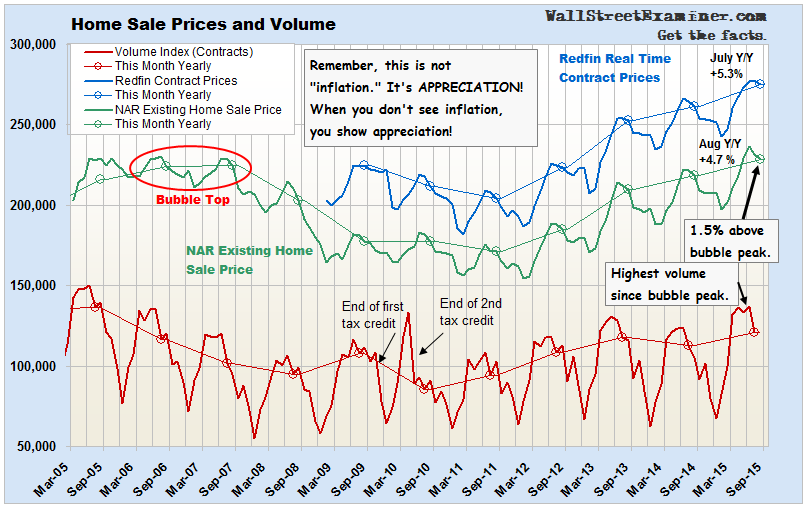
The NAR reported that the median US existing home sale price for sales that settled in August was $228,700, which puts the annual inflation rate for house prices at 4.7%. softer than rates reported earlier this year. House price inflation ran 7%-8.5% between February and May. However, the current rate is much higher than the number that the BLS is recognizing for the housing inflation component of CPI, which they are now plugging at 3% for a 41% weighting in Core CPI. By overweighting housing, then under reporting housing’s actual inflation rate the BLS has systematically cut headline CPI by 1/2 to 1%.
The NAR data represents sales that settled and were recorded by county governments in August, but generally took place in June and July on average. At the same time, Redfin has released data collected from MLS services in the 55 largest US metropolitan area for current contract prices in August. Unlike the lagging NAR data, this is real time market data released within a few weeks of the end of the month. Their data showed August contract prices rising by 5.3% year over year to a median sale price of $275,195. This data has shown a relatively stable housing inflation rate ranging between 4.5% and 6.5% since February.
Click here to view chart if reading in email
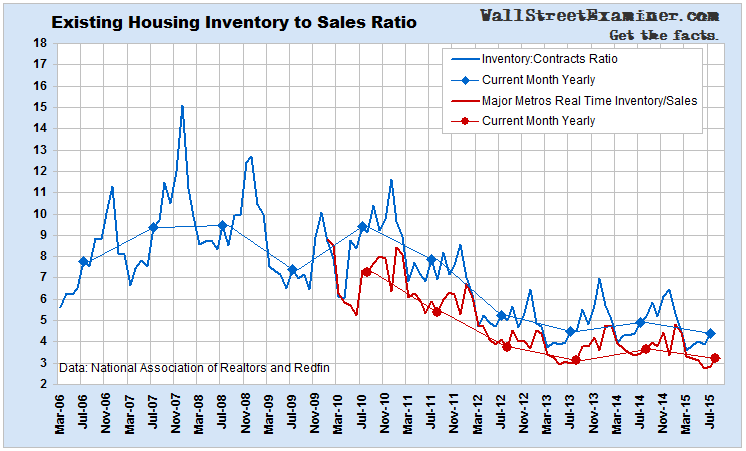
Housing inflation, while slower than in 2013, continues to rage on at a steady pace in spite of falling affordability. The housing market has a massive problem with low inventories against near record purchase demand. Sales volume is running at the highest rates since the top of the housing bubble in 2005 and 2006. Inventory in the market is at record lows. Both the NAR lagged data for the entire US, and the real time market data from Redfin for the 55 largest US metros show the inventory to sales ratio is at record lows. These are the conditions which cause housing inflation.
Click here to view chart if reading in email.

