
There were two important releases on the US housing market today. One is the widely followed Existing Home Sales report from the NAR and the other is a lesser known but more in depth report from the online real estate brokerage Redfin.com. The Wall Street Journal reported that “Existing-Home Sales Fall for Second Straight Month,” referring to the NAR report. Redfin’s report took a more positive slant on its data, but it gets more media coverage. Redfin also pointed out, correctly, that calendar factors played a significant role in the August numbers.
Summarizing the data, the Journal reported that, “Sales of previously owned homes fell 0.9% from a month earlier to an annual rate of 5.33 million, the National Association of Realtors said Thursday. Economists surveyed by The Wall Street Journal projected home sales would reach a rate of 5.46 million in August.” Oops, there’s the bugaboo of seasonally adjusting a month and then multiplying that number by 12 to magnify whatever adjustment error is inherent in the monthly report.
The WSJ summarized its analysis thusly. “The latest drop is fueling concerns that the market is becoming a victim of its own success, with a run-up in prices in big metro areas leaving many homes unaffordable for middle-class families, including first-time home buyers.” Fair enough. That sounds reasonable to me.
The Journal did note that, “The market remains steady over a broader period, with existing-home sales up 0.8% in August compared with a year earlier.” Oddly enough at this time last year the Journal reported that August 2015 sales were down by 5.3%, a truly terrible performance that was much worse than this August. Could it bee-e-e-e-e, SEASONAL ADJUSTMENT?
The actual, not seasonally finagled data showed sales up by 28,000 units this August to 541,000, a gain of 5.6%. In August 2015 sales FELL by 47,000 units or 9.8%. In August 2014, there was a drop of 1,000 units. Parents are getting the kids ready to go back to school in August. Other families are taking their last vacations of summer. August sales are lower than July’s more often than not. So how is it that the largest August increase since 2012 turned into a reported drop in sales?
In this case I must give the statisticians the benefit of the doubt. The calendar was, indeed a problem. Redfin gave us a heads up on this point. “The boost was due in part to a calendar aberration in July that pushed out some closings into August. In addition, August 2015, when sales slid 18 percent from the previous month and grew by just 2.6 percent year over year, was the low point in an otherwise strong year for housing.” The WSJ failed to mention this point.
The Journal said that sales were up 0.8% year over year. Yet actual sales for August were up 5.6% year over year. The statisticians will tell you that there were only 21 business days in August 2015, versus 23 in August 2016. I’ll concede the point here.
A very long time ago, I was a realtor. I was also a mortgage broker. I have experienced the behavior of buyers and sellers, and title insurance companies, first hand. If people want to settle in July, they typically squeeze the closing in at the end of July. If they want to settle in August, then they’ll get it into August. However, if the last 2 days of the month are Saturday and Sunday then there would be some spillover into the next month. July’s last business day was the 29th this year, so some closings would necessarily need to be pushed into August, boosting sales for that month. So in fairness, I must say that the seasonal adjustment could have accounted for that.
Unlike the NAR report, Redfin’s report did not get a single mention in any mainstream financial news reports. It’s data on the 30 large metros showed sales increasing in August by 9,250 units or 3.4%. Again, that was the best August performance in 4 years. But again, the calendar played a role.
To get around the calendar day issue without resorting to the statistical torture of seasonal adjustment I compared the most recent 3 months actual sales to the actual sales count the same period last year. This year the last 3 months showed a 0.6% year to year gain over the same period in 2015 in the NAR data. That’s not good. In 2015 at the end of the June-August period, they were up 10%.
The best way to get a picture of the trend is to get a picture of the trend–not the idealized seasonally manipulated trendline, but the actual trendline using the actual data. We merely need to construct the graph of the actual data, then apply basic technical analysis to clearly see where the trend is headed.
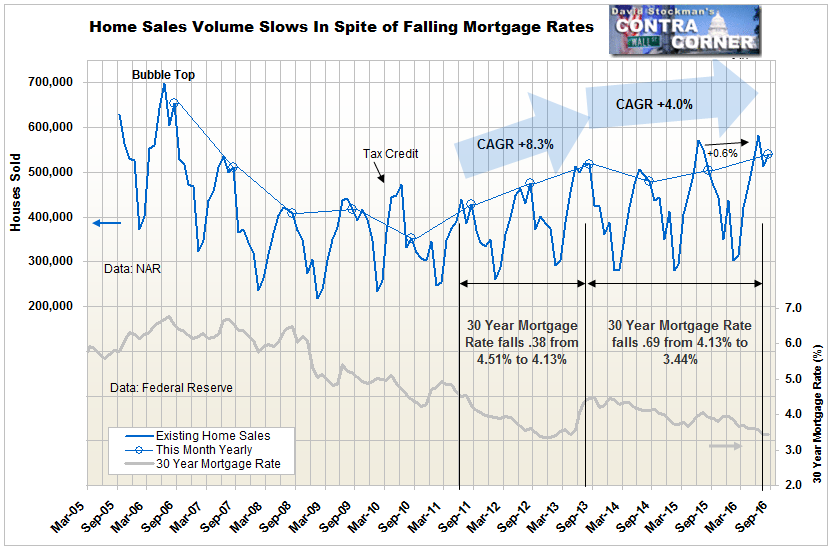
While mortgage rates have continued to fall, the growth rate in home sales has been cut in half from 8.3% annually to just 4% annually over the past years. Worse, peak to peak growth between last year and this year is now just 1.7% including the calendar boost. Based on the latest 3 month total it’s just 0.6%. Falling, super low mortgages have been providing buyers with an ever larger subsidy, but low rates are no longer stimulating sales growth. The transmission mechanism is broken.
Redfin’s data on 30 of the largest and most active markets in the country confirms the slowing. Redfin shows the sale growth rate in the most popular US markets falling to just 2.3% between the 2015 peak in July and this year’s peak in June. The growth rate had been more than 15% per year through 2013. While sales in the big metros have increased faster than the the country as a whole, they have seen a sharp slowing in the growth rate over the past couple of years, similar to the pattern in the NAR’s count of all sales throughout the country.
In our next post on this topic, I’ll cover what current sales data tells us about how demand interacts with existing supply, and what that means for the ongoing housing price inflation.
Lee Adler first reported in 2002 that Fed actions were driving US stock prices. He has tracked and reported on that relationship for his subscribers ever since. Try Lee’s groundbreaking reports on the Fed and the forces that drive Macro Liquidity for 3 months risk free, with a full money back guarantee.

