
While the orthodoxy continues to try to reassure everyone that the economy is still moving to plan, revised innumerably over the years imperceptible as progress has been, there are signs that even mainstream outlets are at least starting to question whether or not that is actually preferable. Not a lot of dots are connected yet, and certainly not from A to Z in comprehensive fashion, but the narrowing of the ends has begun in what can (I stress can) eventually lead to an end to the opacity that has driven a perverse kind of financial and economic apathy.
There is always something to endanger that process, typically as this persistent malaise and disfavor will end up as a political tool in both directions, but it gets harder and harder to justify the status quo. Part of the problem is defining the status quo right at the outset, but even that is beginning to take shape in the larger public. What is now conventional wisdom was never even thought possible a decade ago, namely that the US has undergone a shift of impoverishment that is wholly incredible.

The most recent piece of the façade to crumble has been due to various studies on changes in household “wealth.” Though these typically define “wealth” in paper and asset price terms, we can’t ask for perfection as they at least, as I said, are beginning to define this dysfunction. According to the Russell Sage Foundation, via BloombergBusinessWeek, most people are now worse off, again in paper wealth terms, than they were thirty years ago. The only classes doing any better are those at the very top, which is where politics is injected and most often clouds rather than clarifies.
None of this is particularly earth-shattering as it conforms to what most people would describe of their familiarity with such problems. However, as economists are nothing more than regressionists and statisticians this provides a mathematical response to those wholly inclined to only math. While it is good that some mainstream attention is devoted to noticing that the Great “Moderation” wasn’t as favorable as it was celebrated, the next steps need to be taken where the mild uprising doesn’t just end at “wow, this is bad.”
There are two pieces to this larger depressive narrative: debt and assets. Net worth is, of course, the netting out of the two, so it is the dual trajectories in both that have created such a massive containment on true economic and financial advancement. Taking the latter first, assets, there was a huge change in behavior toward the middle and end of the 1980’s.
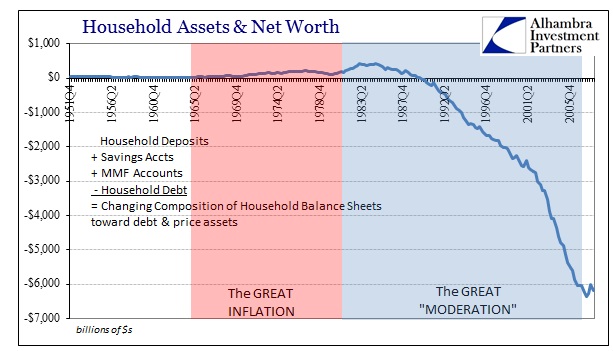
Historically without fail, domestic households used liquid assets as a moderator or even governor on the pace of debt accumulation. In the chart above that is amply evident, as the liquid asset side was always greater than debt. That also makes intuitive and familiar sense, particularly as that was the Great Depression generation which was far more likely to be financially conservative in that fashion.
By the late 1980’s, however, debt balances began to rise much faster than liquid assets. No longer was cash and equivalents the main feature driving both marginal net worth and limitations on credit. Throughout the Great “Moderation” household debt accumulated far, far faster than liquid assets, as net worth calculations changed over to asset price inflation. That included both housing assets and stocks.
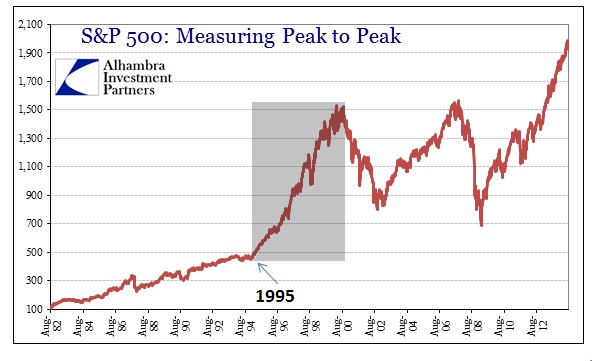
Stock prices, which had been fully encapsulated within a robust and durable bull market, dramatically shifted still upward around the beginning of 1995. What had been a spectacular advance on its own morphed into an anomaly of historic proportions. With that factor driving net worth calculations, household experience of financialism tended toward this new paradigm of credit animating spending based on the assumption of assets that would maintain prices, and even price appreciation.
But it was not just stocks that were fostering this shift. Convention speaks of the housing bubble as if it was contained to only the mid-2000’s, but that is simply not the case. Based on several measures of home construction and prices, the bubble broke out right around 1995-96.
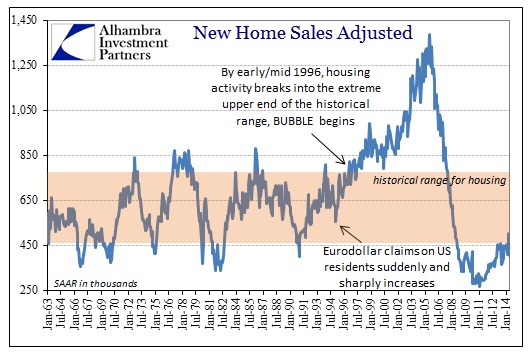
From 1996 until the great crash that began a decade later, new home construction (and sales) remained above its historical range without exception. Even during the 2001 recession, even acknowledging its mild nature, the slack in pace only brought sales down to a level still considered atypical. From there, of course, the mania took hold which is why attention is fixated in that part of the chronology. However, the full part of the bubble traces back to the mid-1990’s, coinciding almost exactly with stock prices heading into their new trajectory – bubbles in both major household assets simultaneously.
There were several highly important and significant changes to the financial system during the 1990’s, not the least of which was the first full “experimentation” with monetary policy as interest rate targeting rather than some combination with targeting reserves. Beyond that, and very much related, the shadow banking system had almost entirely taken over the marginal production of debt and credit – the S&L crisis pretty much finished the traditional bank model.
The shadow system meant not only new means of debt creation but also a radically different funding environment. Short-term liabilities and wholesale money were the primary balance sheet operations, “limited” not by cash balances, Fed reserve requirements or anything like a traditional bank, but rather accounting measures of equity.
But it was the funding system that saw the most drastic shift, even as loans were being pooled and securitized at greater and greater rates (unlocked finally for a mass market in 2000 by David Li’s Gaussian copular inference for default correlation). No longer would financial firms depend on deposits for funding, as the eurodollar market itself became something far more than a replacement for the gold standard in international trade. A chart I have used several times before illustrates this changing character quite clearly. From the BIS:
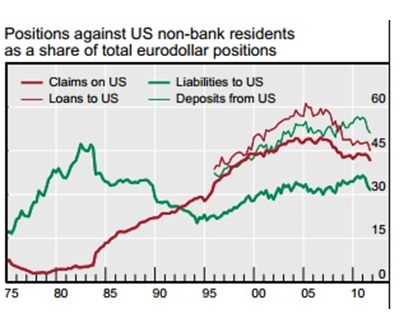
The system for creation and trade of eurodollars that were originally meant exclusively for global trade had, by the mid-1980’s, begun “leaking” back into the US as loans to US residents (claims on US). What that meant, in practical terms, was that the derivative US money supply was marginally predicated (to a very high proportion) on banking developments outside the United States – the “hub and spoke” system of European banks had as much to do with the asset bubbles as Bear Stearns, Countrywide or any of the other NYC behemoths. What that meant was that banks in Europe were taking local deposits, denominated in local currencies (especially before the introduction of the euro), and transforming them to US$’s, via currency derivatives and eurodollar levels, and thus US$ credit to US residents.
The lack of any real regulation in eurodollars was the enticement, as was the loose nature of the Fed’s interest rate targeting regime. There was a very durable relationship between LIBOR (eurodollar rates) and federal funds, made so by the accounting nature of US banks and their London subs (or foreign banks operating in London and their US subs in NYC). Where the Fed was taking credit and money supply as only a local, domestic affair, its enabling monetarism was taken at an extreme globally through eurodollars. The final and intense acceleration in claims on US, eurodollar lending to US residents, took place at the outset of 1995.
None of that mattered directly to Alan Greenspan and his compatriots because the asset bubbles were “convincing” enough to households that they were taking on massive accumulations of debt – and thus seemingly “filling in the troughs without shaving off the peaks.” It was, as they told us contemporarily, the Great “Moderation.”
The problem of transforming net worth and its relation to debt is the laws of price appreciation. Nothing goes up forever, though there were more than a few expressions and accolades over the “new normal” (and actually the faster and longer the straight-line advance the worse the inevitable reversion to the mean), and the persistence of monetarism to try to define a credit “solution” to every bust cycle has only amplified, over and over again, the disparities here. The problem now infects both sides of the household balance sheet, as asset prices are, at best, highly unstable. And while asset prices gyrate as bubble cycles do, debt balances remain unpaid and only hopefully rolled over in perpetuity.
But the asset price inflation of this third go around is actually quite misleading. Taken in actual history, there has been very limited growth for now more than 14 years (in stocks). Add that together with the housing bust, including the latest mini-bubble that seems to be concluding, and the asset side for households can only be beneficial to those at the upper levels – those with enough actual cash flexibility to take advantage of these massive swings.

Despite the “record” highs, the S&P 500 has seen only a 1.62% compound annual return on a nominal basis; deflated by the CPI, the return is an all too “real” -0.96% compound annual. And that represents the likely best case for most people, as they more often than not experience returns much worse than the overall index. The reason for that is, again, the lack of cash flexibility that a generation ago (or two now) was so very much a part of kitchen table finances.

So where we have growing and persistent financial imbalances that are finally gaining some real attention, on both the asset and liability sides of the household ledgers, the commonality through all of it is simple, persistent and ultimately destructive monetarism. Orthodox economics assigns debt as the ultimate solution to “pump priming” and business cycle maintenance, so the various means to carry that out were created and facilitated in so very short-sighted fashion – but there is no monetary neutrality.
Asset bubbles, which may or may not have been inevitable under such a construction and framework, were just an expression of that overall trend and appeal. In short, the common function to all of this is an improper set of the price of risk, and thus disabling all means of self-correction and especially financial limitations. All modern monetarism depends upon it in the vanity of commanding economic function, and the utilization of mispricing rates and risk is the most corrosive aspect leading to this decades-long trend of growing impoverishment. Economists hate the gold standard and admire their own creations, but they need to take account for the destruction such devotion to “flexibility” has wrought; and further acknowledge that the primary role of the gold standard was to ensure that everything you see here would be utterly impossible.
It is not coincidence, in light of the 100th anniversary of WWI, that the Great Depression and its own bubble collapse followed just such a similar period whereby the gold standard was bypassed in favor of central bank and central government flexibility and intentional imbalance. Intense financialization is only possible where limitations are removed, but in the end no matter the progress and evolution of its expressions and methodologies the end results are the same – systemic poverty.
Click here to sign up for our free weekly e-newsletter.
“Wealth preservation and accumulation through thoughtful investing.”
For information on Alhambra Investment Partners’ money management services and global portfolio approach to capital preservation, contact us at: jhudak@alhambrapartners.com

