
The price of oil has plunged nearly 40% since June to $65.63, and junk bonds in the US energy sector are getting hammered, after a phenomenal boom that peaked this year. Energy companies sold $50 billion in junk bonds through October, 14% of all junk bonds issued! But junk-rated energy companies trying to raise new money to service old debt or to fund costly fracking or off-shore drilling operations are suddenly hitting resistance.
And the erstwhile booming leveraged loans, the ugly sisters of junk bonds, are causing the Fed to have conniptions. Even Fed Chair Yellen singled them out because they involve banks and represent risks to the financial system. Regulators are investigating them and are trying to curtail them through “macroprudential” means, such as cracking down on banks, rather than through monetary means, such as raising rates. And what the Fed has been worrying about is already happening in the energy sector: leveraged loans are getting mauled. And it’s just the beginning.
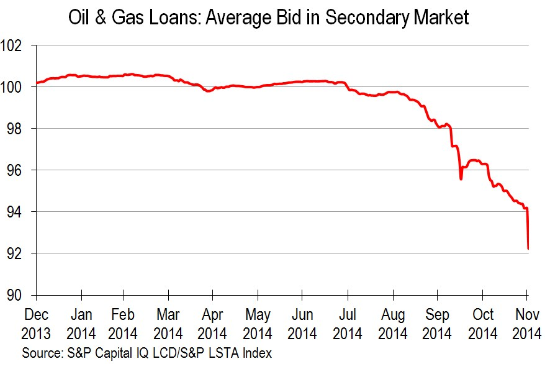
This monthly chart by S&P Capital IQ’s LeveragedLoan.com shows the leveraged loan index for the oil and gas sector. Earlier this year, when optimism about the US shale revolution was still defying gravity, these loans were trading at over 100 cents on the dollar. In July, when oil began to swoon, these loans fell below 100 cents on the dollar. The trend accelerated during the fall. And in November, these loans dropped to around 92 cents on the dollar.
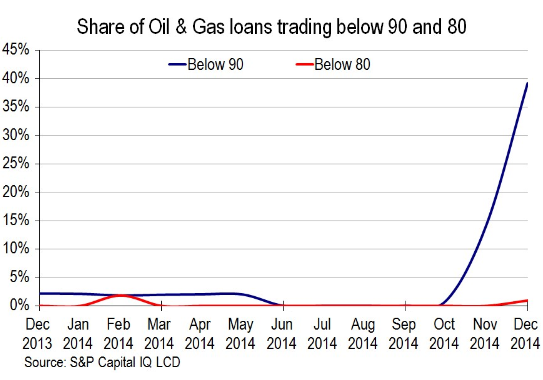
How bad is it? The number of leveraged loans in the oil and gas sector trading between 80 and 90 cents on the dollar (blue line in the chart below) has soared parabolically from 0% in September to 40% now. These loans are now between 10% and 20% in the hole! And some leveraged loans are now trading below 80 cents on the dollar (red line):
“If oil can stabilize, the scope for contagion is limited,” Edward Marrinan, macro credit strategist at RBS Securities, told Bloomberg. “But if we see a further fall in prices, there will have to be a reaction in the broader market as problems will spill out and more segments of the high-yield space will feel the pain.”
Oil and gas stocks are bleeding: the Energy Select Sector ETF (XLE) is down 21% from June; S&P International Energy Sector ETF (IPW) down 29% from early July; and the Oil & Gas Equipment & Services ETF (XES) down 42% from early July.
Smaller drillers are in trouble. All of them had horrific single-day plunges, some over 30%, on “Black Friday” after OPEC’s Thanksgiving decision to keep production quotas at 30 million barrels per day. By now, “Black Friday” has acquired an entirely different meaning in the oil patch than its classic meaning in retail. Traders who tried to catch these stocks have gotten their fingers sliced off since then:
- Goodrich Petroleum -88% since June.
- Energy XXI -86% since June
- Sanchez Energy -78% since June.
- Oasis Petroleum -75% since July.
- Triangle Petroleum -71% since June.
- Stone Energy -70% since April.
- Clayton Williams Energy -62% since May.
- Callon Petroleum -61% since June.
- EP Energy -60% since June.
These are the very companies that benefited during the crazy good times from yield-desperate investors who’d been driven to obvious insanity by the Fed’s interest rate repression. These investors – such as your bond mutual fund or your pension fund – loaded up on energy junk bonds and leveraged loans. And now the Fed-inspired financial house, where all risks have been eliminated by QE Infinity and ZIRP, is rediscovering risk.
Turns out, the Fed, so ingeniously prolific in buying financial assets to inflate their prices, can’t buy oil.
Companies in the sector are now facing a harsh reality: crashing revenues and earnings. Some of them are going to have liquidity problems. Unless a miracle happens that will goose the price of oil pronto, there will be defaults, and they will reverberate beyond the oil patch. And the consequences are felt far beyond the American oil patch [read… Saudi Arabia Declares Oil War on US Fracking, hits Railroads, Tank-Car Makers, Canada, Russia; Sinks Venezuela ].
But even the 43 largest, most diversified players in the energy sector that are part of the S&P 500 are grappling with the new reality: analysts chopped earnings estimates by 20.5% since September 30, according to FactSet. If this is final decline for the quarter – though the chopping is likely to continue – it will be the worst decline in EPS estimates since the first quarter of crisis-year 2009.
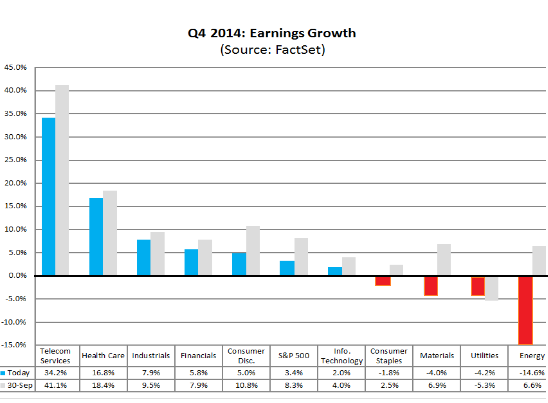
As of Friday, analysts expected the energy sector to report a 13.7% drop in revenues. At the beginning of the quarter, they’d expected a decline of only 1.7%, though oil prices had been plunging for three months. And they now expect a 14.6% swoon in earnings, as opposed to the 6.6% gain they still saw at the beginning of the quarter. This chart by FactSet shows the ugly reversal of their EPS expectations (ugly red bar on the far right) – and just how far they lagged behind when the quarter began:
All of the energy companies in the S&P 500 got their EPS estimates decimated, even the biggest ones: Exxon Mobil by 20%, Chevron by 25%, Hess by 47%, Murphy Oil by 50%, and Marathon Oil by 63%.
Exxon CEO Rex Tillerson told CNBC that his company could get by with $40 oil by refocusing on basics, “watching your cash, watching your investment decisions, being very disciplined about everything….” But he didn’t elaborate for how long. And lesser companies may run out of options, or cash, long before then.
The effects are already being noticed as a desperate feeding frenzy takes its course. Read… Corporate Bond Bubble Comes Unglued at the Bottom, Investors Begin to Bleed

