
Housing demand growth is slowing, so why is housing inflation continuing at a steady pace more than twice the rate of the CPI? The answer is simple- tight supply and a mortgage rate subsidy that reduces the effective cost of a house to the buyer, thereby increasing the purchase price that buyers can pay.
The initial effective cost of a house purchase is the monthly payment. If you own a home or are considering buying one and if, like most homeowners, you have a mortgage, your first concern is not the price of the house. First you determine what you can afford to pay. This is based on the ratio of the monthly payment, what those in the industry call “PITI,” to your household income. Under the standard qualifying ratio, the monthly PITI should not exceed 28% of gross household income. Buyers look at the cost of a purchase as being limited to that amount. Loan underwriting gets a little fuzzy around the edges, but there’s a market wide qualifying ratio limit somewhere just above that level. Once the preponderance of buyers in the market has hit that level, they can’t and won’t pay more for home purchases than that line in the sand. When that limit is reached, sales volume begins to recede and inventory increases. Sale prices then fall.
PITI really is a pity for us suckers who have mortgages. With insurance and taxes, in the end we pay a total of roughly 2.5 times the initial purchase price of the house to pay off the loan with interest, plus the taxes and insurance. That doesn’t even begin to account for the lifetime cost of maintaining the property. Houses depreciate physically if not maintained. More importantly they depreciate economically as market tastes change. If you haven’t remodeled your house to current standards at least once near the end of your 30 year holding period, it becomes a classic “fixer upper”. As we all know from the vast real estate expertise we gather from watching HGTV, fixer uppers are deeply discounted.
If we hold the property for 30 years, leverage and inflation could bail us out from our initial stupidity. But there are no guarantees. When all the long term costs of homeownership are added up, in most markets you’d be lucky to break even.
While many buyers are aware of those facts, the long term cost is not the issue. Buyers are really only concerned about the monthly payment. Mortgage rates have fallen thanks to the world’s central banks buying MBS and other every piece of long term fixed income paper that isn’t nailed down. The monthly mortgage payment would also fall if prices remain constant. That’s not how the market works, however. Virtually all buyers will pay whatever the maximum monthly payment would be at standard qualifying ratios. If the cost of the interest component of PITI falls, then the cost of the principal component increases. As rates fall, it is the monthly payment which remains constant. Prices rise as a result.
That’s central bank monetary inflation, pure and simple. Economists and their mainstream media PR flacks don’t like to call it that, referring instead to “growth” or “appreciation.” But around here we like to call a spade a spade. When the moon hits your eye like a big pizza pie, that’s a pizza. When house prices go up faster than CPI, that’s inflation.
So how much inflation do we have? According to the NAR, house prices in August rose by 5.2% year over year. Redfin’s numbers were slightly lower at 4.3%. Both are 2 to 2.5 times faster than the CPI inflation rate. Both showed only minor fluctuations from the year before, when the NAR showed an increase of 4.6% and Redfin had 5.3%.
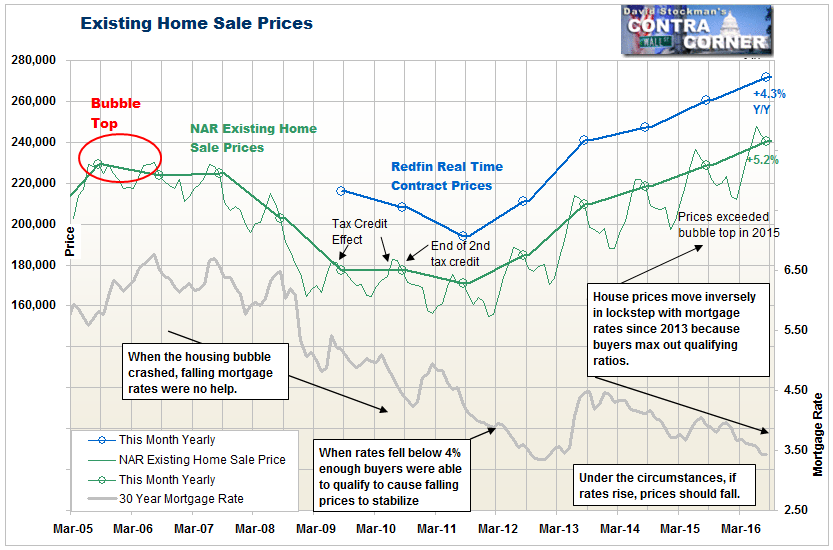
Prices have risen in concert with falling mortgage rates since 2013. That year seems to be when buyers in the aggregate reached the constraint of being at the maximum qualifying ratio, which is typically when PITI hits 28-30% of a buyer’s gross income. Once buyers reach that ratio, the only way that they can pay more is if their earnings increase, or if the interest component of PITI falls. That has become a function of central bank policy, not just Fed policy, but the ECB and BoJ’s as well.
While the Fed is treading water in removing MBS from the market, the ECB and BoJ continue to actively print money to acquire fixed income and other securities, and thereby push long term rates into negative territory. That drives money into the US market where it then further suppresses Treasury yields and thus the yields on mortgage securities.
The suppression of rates creates a subsidy for homebuyers. If central banks were not aggressively intervening in the fixed income markets, rates would be higher, probably in the range where they normally have been historically. There would be no buyer subsidy and no inflated housing prices. Instead, monetary policy has directly driven housing price inflation.
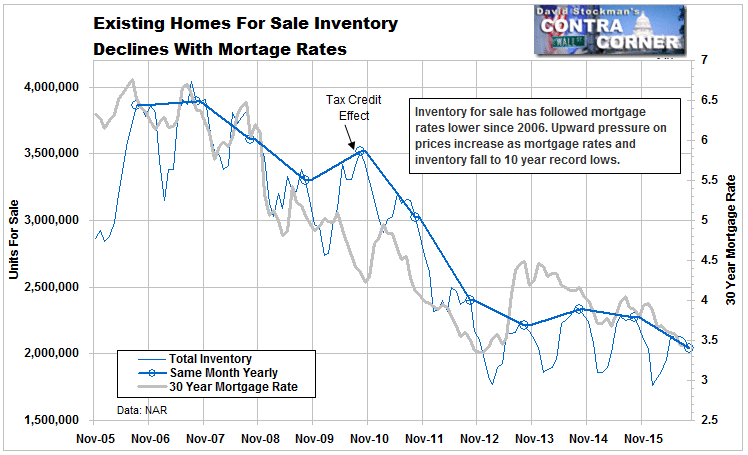
Another problem contributing to housing inflation is that as mortgage rates decline, so does inventory. There are more buyers than there normally would be, and they deplete inventories faster than would be the case in the absence of the central bank subsidies.
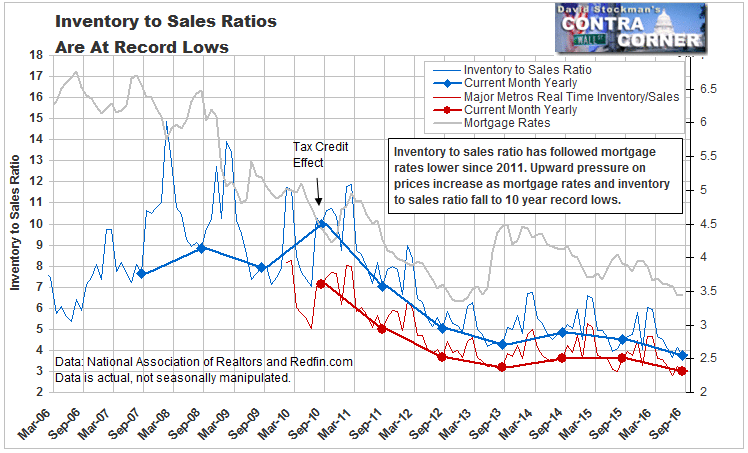
The fact that this relationship exists is perfectly clear on the charts. The correlation between falling rates and falling supply of houses for sale is clearly visible when the two lines are overlaid. Artificially stimulated demand artificially reduces supply. Exacerbating the problem is the fact that sellers who have retired and whose houses are paid off, are discouraged from liquidating their properties. They have no low risk alternatives for getting a decent return on the cash that would be generated from a sale. So they hold on to their houses.
As a result, today inventories are at 10 year record lows. If rates begin to tick up steadily, demand would fall and inventory would build as a result. Due to the limitation imposed by the qualifying ratio, buyers would be forced to spend less as rates rose. It’s an understatement to say that that would not be a bullish situation.
Today’s housing market conditions are supposedly are as good as it gets. The world’s central banks have driven mortgage rates to record lows, which supposedly would make buying a house more affordable than ever. Total US employment is reported growing at a steady pace. US household income is also reportedly growing rapidly. The truth is that the number of jobs may be growing, but they are predominantly low pay, and there are reams of data suggesting that US household income is not growing anywhere near as fast as the latest government report says.
When we peel back the layers of the onion, we find that the housing market’s performance is nowhere what you would think given how favorable the conditions superficially appear. Housing prices are rising twice as fast as CPI and probably more than twice as fast as household incomes correctly reported. As rates fall, the purchase price that buyers can pay rises. In addition, falling rates have driven the supply of homes for sale down. Now, as prices continue to rise, buyers have largely maxed out their qualifying ratios. Fewer and fewer can afford to buy as prices continue to rise. Consequently, growth in sales volume has slowed.
These conditions have put the Fed between a rock and a hard place. Any rise whatsoever in mortgage rates now will force more buyers out of the market. Inventory will rise as sales fall. At some point rising rates will cause more sellers to sell. Supply would continue to increase as demand fell.
The first sign of the bubble top in 2006 was a sharp drop in sales volume. It preceded the collapse in prices by about a year. But the reported prices in that last year as the price curve rounded over were illusory. Inventories rose, but the market had dried up. Selling a home during that 2006-2007 period, before it became clear that the market was collapsing, was like winning the lottery.
Today we have not yet seen sales volume fall in absolute terms. But market activity has slowed dramatically in the past year. Meanwhile, prices are still inflating. The market will eventually, probably soon, reach a tipping point. Sales activity will begin to shrink. At that point the price top will be in and the illusion of a healthy housing market will once again be proven to be a mirage.
Lee Adler first reported in 2002 that Fed actions were driving US stock prices. He has tracked and reported on that relationship for his subscribers ever since. Try Lee’s groundbreaking reports on the Fed and the forces that drive Macro Liquidity for 3 months risk free, with a full money back guarantee.

