
The mainstream media likes to give short shrift to the second half of the NAR’s misnamed monthly report on “Existing Home Sales.” Yes, they’re existing homes. No they’re not sales, they’re sale closings. The sale takes place when the contract is signed. The NAR calls that “Pending Home Sales.” When the contract is signed, the buyer and seller have agreed on the price, the Sold sign goes up, and the house comes off the market. SOLD!
The first part of the NAR report focuses on a fictional, seasonally adjusted, annualized estimate of the number of closings. That gets lots of attention. The second part gets a line or two at most.
The second part of the report is devoted to prices. As far as I can tell, this is based not on the official sale recordings, but on the contract prices entered in the NAR’s regional Multiple Listing Services (MLS). It is actually the most timely data available on house prices in the market. Unlike the number of sales, the median and average sale prices are reported on an actual, not seasonally adjusted basis. What you see is what you get. It’s the “real deal.”
I have worked with this data for a lifetime. I have used it in my analysis in the Wall Street Examiner for the past 16 years. For 14 years before that I used it when appraising residential development projects, which I did as a commercial real estate appraiser in Florida from 1988 to 2001. Before that, I used the data in the the mid 1980s as a realtor and as a mortgage broker. In my experience, the aggregated MLS data on the local, regional, and national market has been logically consistent, both with other data and with my own direct experience.
Unlike the more widely followed and hideously manipulated Case Shiller Indexes, the aggregate prices which the NAR reports are unsmoothed, and not statistically manipulated. They are ragged and jagged, just like reality. It is raw data, just the way I, as a technical analyst, like to see data, in its purest form.
I’ll let my eyes and a tool that can draw straight and curved lines do the analysis. Fudged data like Case Shiller’s (CS) often hides the truth of the trend. At the very least CS lags it to such a degree that it’s worthless in telling us what the market is currently doing.
So in the interest of seeing what’s happenin’ now, here’s a chart of the actual price data through November reported via all the nation’s MLS’s. This is compared with how Case Shiller currently depicts the market.
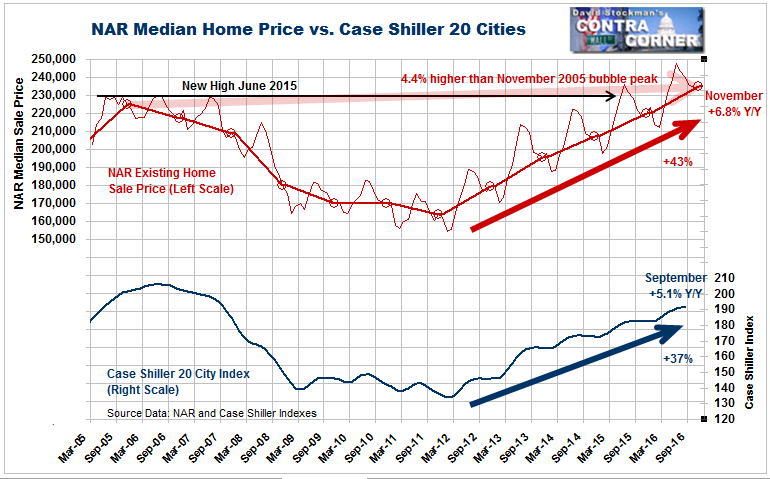
The chart compares the NAR data, which is actual and timely, with the ultra smoothed, ultra lagged, CS. The Case Shiller 20 Cities Index is also skewed toward overweighting older houses in poorer condition than is typical in the market as a whole. Keep this in mind next week when the CS for October! is released next week.
Keep in mind also that because of its statistical buffoonery, Case Shiller actually represents contracts centered on the June-July period. It depicts a downwardly skewed version of where the market was last summer, not where it is now.
The Zombie housing bubble began to come back from the dead in 2011. Since then house prices have inflated by a whopping 43%. Prices are now 4.4% higher than the peak of the Great Bubble in 2005 and 2006.
The year to year inflation rate was. 6.8% in November. Such an inflation rate can only be sustained if wages and salaries are rising as fast or if mortgage rates are falling faster. Otherwise, fewer and fewer homes would be sold as fewer buyers qualify for mortgages. Wages and salaries are only rising at 1/3 the rate of house price inflation. But that was covered up by constantly falling mortgage rates… until last month.
I call the period from 2011 until today the Zombie Bubble because the Fed has brought the housing bubble back from the dead. It did that through an active policy of QE.
The Fed bought Treasuries and mortgage debt, driving up their prices and driving down yields. The Fed’s buying also took both Treasury debt securities and mortgage debt securities off the market. The reduction of supply of fixed income securities in the market also caused their prices to rise and yields to fall, resulting in the lowest mortgage rates in history. That happened twice, once in 2013, and once last summer. It looks like this.
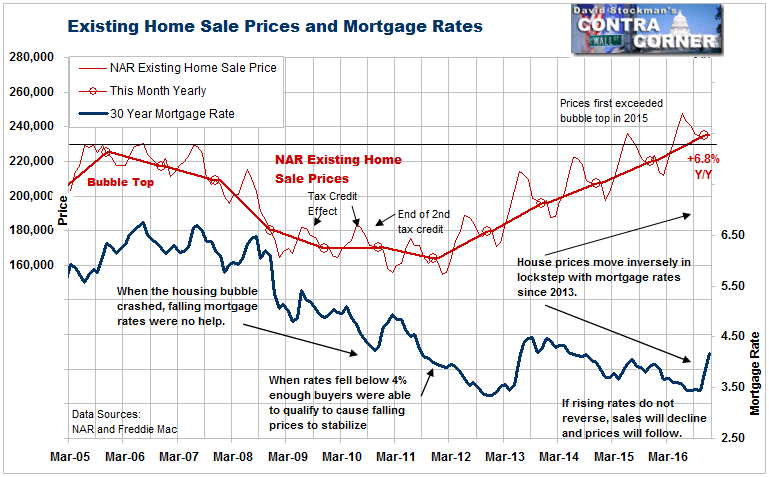
In 2013, early in the Zombie Revival, there was a spike in mortgage rates similar to today’s. Sales volume fell at that time as prices continued to inflate. Back then virtually everyone expected rates to resume their decline as the Fed would continue to encourage falling rates. But even then buyers were stretching. They were constrained by the fact that they could not qualify for higher monthly payments.
So when rates spiked, sales declined. Rates peaked over 3 months in 2013 and then resumed their decline. Prices continued to rage higher as sales volume stabilized in 2014 through 2016 while mortgage rates steadily plunged.
This time is different. The Fed has embarked on a course of increasing interest rates, and has publicly reaffirmed the new policy repeatedly. The consensus is that Trumponomics will give us both a stronger economy and Trumpflation.
Buyers rightly believe that this was their last opportunity to buy at rates this low. I expect mortgage rates to continue rising for different reasons, mainly due to a growing liquidity crisis in the European banking system, which I have covered in depth in other posts.
Under conditions where mortgage rates continue to rise, something’s gotta give. Buyers can only afford and qualify for so much in terms of their monthly mortgage payment. That means that if mortgage rates continue to rise, fewer people will be able to afford to buy at current prices. Ipso facto, fewer people will buy. Sales will collapse. In housing, volume dries up first. Then prices roll over.
As sales collapse, sellers will eventually wake up and lower their asking prices. That will start another vicious cycle of weak sales and falling prices. Chapter umpteen of the Great Financial Crisis (GFC) will be upon us. Financial markets will seize up and probably crash as the demand for cash soars.
What will the Fed do then? It will reverse course and start printing money again.
But first we’ll need to see the effects of rising mortgage rates play out in the market. The seeds of the next financial market crash have been planted. It’s pointless to look beyond that. First, we need to survive. Cashing out now and stepping aside would seem to be the prudent course.

