
Following up on yesterday’s observations about valuations in stocks, margin debt declined in April for the second consecutive month. The absolute change across both March and April is not very large, amounting to $27 billion or 5%. Total cash balances were essentially unchanged, meaning that investors retired margined positions and reduced overall leverage in retail accounts.

Since there was little disruption in the larger cap indices, such as the S&P 500, while smaller cap and momentum equities struggled significantly during those two months we can connect these changes in leverage to high beta investing. It would seem that small caps and “higher risk” names have attracted the most retail leverage since this latest bubble phase began.

Right at the beginning of 2013 investor net worth suddenly and sharply declined, ultimately hitting a record leveraged position in February of this year. In parts, that meant a huge increase in margin debt usage without any tandem increase in cash balances as a buffer. That is pure leverage and risk-taking, now at dot-com levels.

Again, since the slight repeal in March and April was far more of a disruption to the Russell 2000 stocks and others of their kind than larger cap, we can make the reasonable inference that retail leverage is targeting that sector in far greater allocation. That does not mean, however, that larger caps are trading leverage-free, absent the credit-induced mania typical of bubble period.
The latest figures from various sources on stock repurchases show much the same pattern – a clear surge in 2013 that did not abate, contrasting with retail margin, in the early part of 2014. Corporate balance sheets have been funding this repurchase leverage via mostly debt, a proportion that has only grown as cash flow and profitability waned.

That creates a direct credit pipeline from monetary “stimulus” via interest rate targeting into the stock market. And it has had a clear imprint on asset prices, the artificial misallocation impulse of asset inflation.

The S&P 500 Buyback Index tracks the performance of the “top 100 stocks with the highest buyback ratios in the S&P 500.” What we see is an obvious outperformance among stocks with greater buybacks relative to their large cap peers. It is not clear whether that is a direct effect, as in whether the actual repurchase transactions push prices higher on their own, or whether the indirect preference of investors to purchase stocks that engage in this kind of leverage is creating the divergence. I have no doubt that it is a combination of both, but the acceleration of the buyback index starting in 2013 over and above the full S&P 500 times to the surge in actual cash flowing through this redistribution channel. That would suggest, convincingly to me, that the actual dollar amount plays a primary role in pricing.
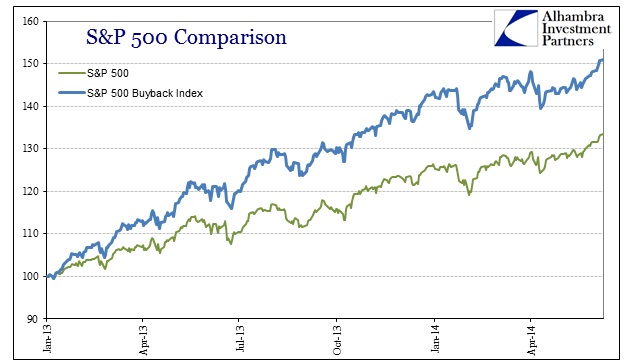
If we break down the chronology of buyback favoritism to that point, the start of 2013, I think we can somewhat quantify, somewhat, this “direct” effect.

Clearly, overall returns have been much greater since the start of 2013 in both indices, which is not surprising. However, the pace of outperformance on the buyback index more than doubles in the last seventeen months over the previous period. That may not be conclusive, but it is highly suggestive and indicative of the actual dollar effect of corporate leverage application.
The combination of retail leverage and corporate leverage is exactly what you would expect – a surge in asset prices. As I noted yesterday, prices have moved far and above the fundamental valuations of corporate net worth and GDP. That also includes nominal PE levels on the main index itself.

The timing of all this leverage is more than coincidental, I think, as it relates to QE3 and especially QE4 (December 2012). Investors becoming complacent about “tail risk” under the cover of central banks’ active promises is pretty much consistent with every market bubble we have seen so far. And that also includes totally ignoring the obvious slowing in earnings (and the overall economy) in setting the applications of both kinds of leverage. That may mean investors didn’t care at all, viewing such central bank “cover” as ubiquitous and comprehensive, or that they held fast to the faith of QE as an effective “cure” to such a slowdown.
In the end, it doesn’t really much matter because the net result is the same – central banks are neither omniscient, nor are their programs at all efficacious. So we end up with a massive surge in leverage, self-feeding and reinforcing in terms of pricing, without the basis that started it all rolling in the first place. Some may resist calling it a bubble, but regardless of semantics it is not healthy or organic.
Click here to sign up for our free weekly e-newsletter.
“Wealth preservation and accumulation through thoughtful investing.”
For information on Alhambra Investment Partners’ money management services and global portfolio approach to capital preservation, contact us at: jhudak@alhambrapartners.com

