
With the 97.8% of fourth quarter earnings reports for the S&P 500 now in, I can update my quarterly analysis of earnings and estimate trends through the 4th quarter of 2015.
Fourth quarter’s results have continued to deteriorate as activity slows amidst the ongoing global deterioration. While many pundits have tried to suggest “this time is different” because the “service” sector has not fallen into contraction, this may be presumptive as the “trend” of the data suggests this is not the case.
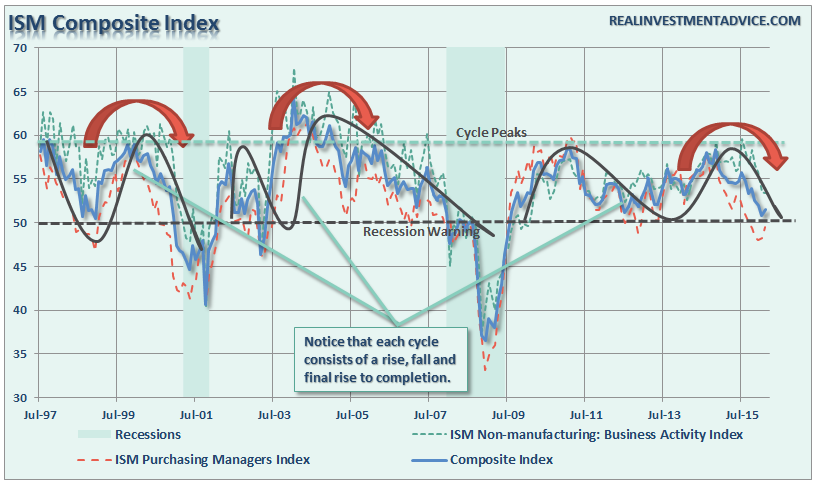
The same can be seen in the Economic Output Composite Index (EOCI) which is comprised of a variety of broad indices including the Chicago Fed National Activity Index, Chicago PMI, several Fed regional manufacturing surveys, ISM composite, NFIB survey and the LEI.

For the quarter, operating earnings fell from $25.44 per share to $23.05 which translates into a quarterly decrease of 9.39%. Of course, operating earnings have all the “crap” in the numbers. More importantly operating earnings FELL have fallen from their peak of $29.60 per share in Q3 of 2014 or 22.13%.
While operating earnings are widely discussed by analysts and the general media; there are many problems with the way in which these earnings are derived due to one-time charges, inclusion/exclusion of material events, share buybacks and accounting gimmickry to “beat earnings.” (For a complete discussion read “The Earnings Season Scandal.”)
Therefore, from a historical valuation perspective, reported earnings are much more relevant in determining market over/undervaluation levels. On a reported basis, earnings declined from $23.22 to $18.63 or 19.77% from the third quarter. But as with operating earnings, reported earnings have fallen an astounding 32.18% from their Q3 peak in 2014.
The decline in both operating and reported earnings for the quarter brought trailing twelve months operating earnings per share to $100.44 which was down from $104.14, a 3.55% decrease. Trailing twelve months reported earnings fell by $4.20 from $90.66 to $86.46, a decrease of 4.63%.
Importantly, the decline in quarterly earnings is consistent with the deflationary and weak economic underpinnings that have been exacerbated by the collapse in commodity prices, particularly oil.
Most importantly, as noted by Dubravko Lakos-Bujas at JP Morgan:
“Declining corporate profits as measured by US equity EPS have been closely followed by, or coincided with, a recession 81% of the time since 1900,”
Always Optimistic
There is one commodity that Wall Street always has in abundance, “optimism.” When it comes to earnings expectations, estimates are always higher regardless of the trends of economic data. The problem is that the difference between expectations and reality has been quite dramatic.
There is no doubt that corporate profitability has surged from the recessionary lows. However, if I am correct in my assessment, the recent downturn in corporate profitability is likely more than just “oil related.”
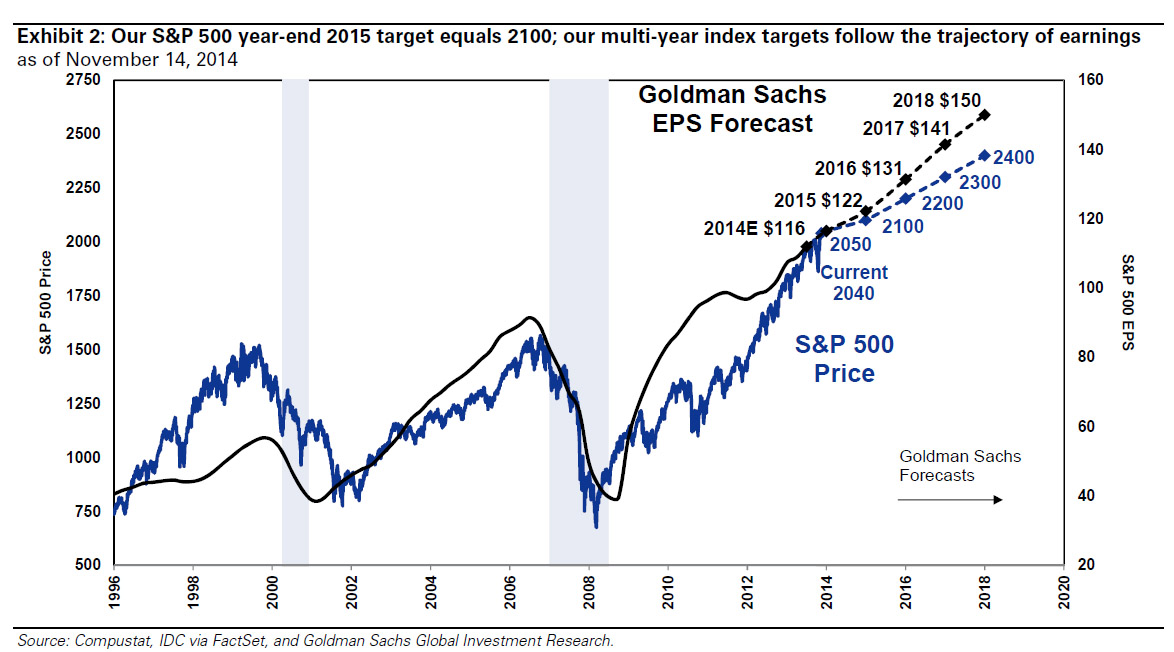
The problem with cost cutting, wage suppression, labor hoarding and stock buybacks, along with a myriad of accounting gimmicks, is that there is a finite limit to their effectiveness. While Goldman Sachs expects profits to surge in the coming years ahead – history suggests something different.
The chart below compares economic growth to earnings growth. As shown above, Wall Street has always extrapolated earnings growth indefinitely into the future without taking into account the effects of the normal economic and business cycles. This was the same in 2000 and 2007. Unfortunately, the economy neither forgets nor forgives.
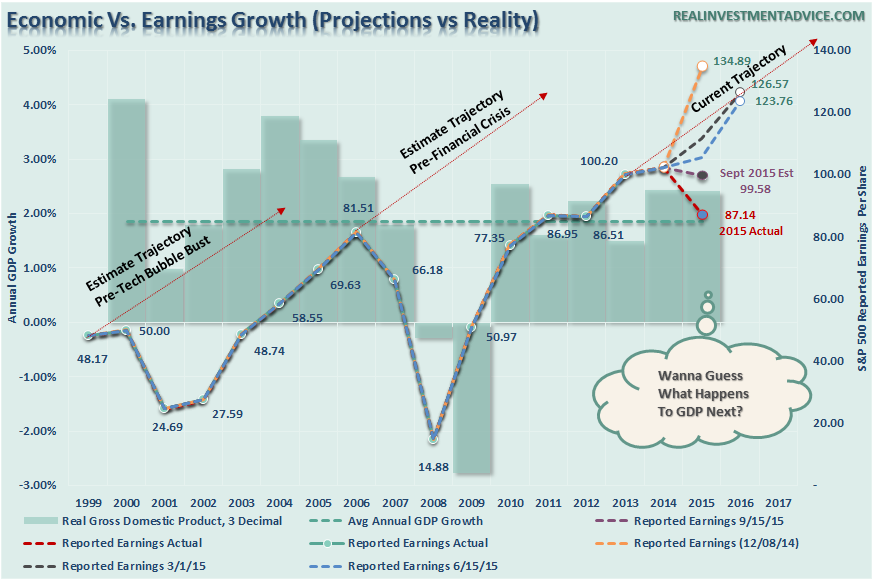
With estimates once again very optimistic, and given a complete disregard to the late stage of the current economic cycle, there is currently not one Wall Street analyst expecting a recession.
Unfortunately, it is only a function of time until the next economic downturn takes hold, particularly given the currently weak global outlook. As shown, earnings tend to cycle regularly between 6% peak to peak and 5% trough to trough growth in earnings. In 2014, expectations exceeded the current 6% peak to peak growth rate. I said then that it was only a question of what will trip up such overly optimistic picture. We now have that answer and real earnings have fallen far short of those original estimates.
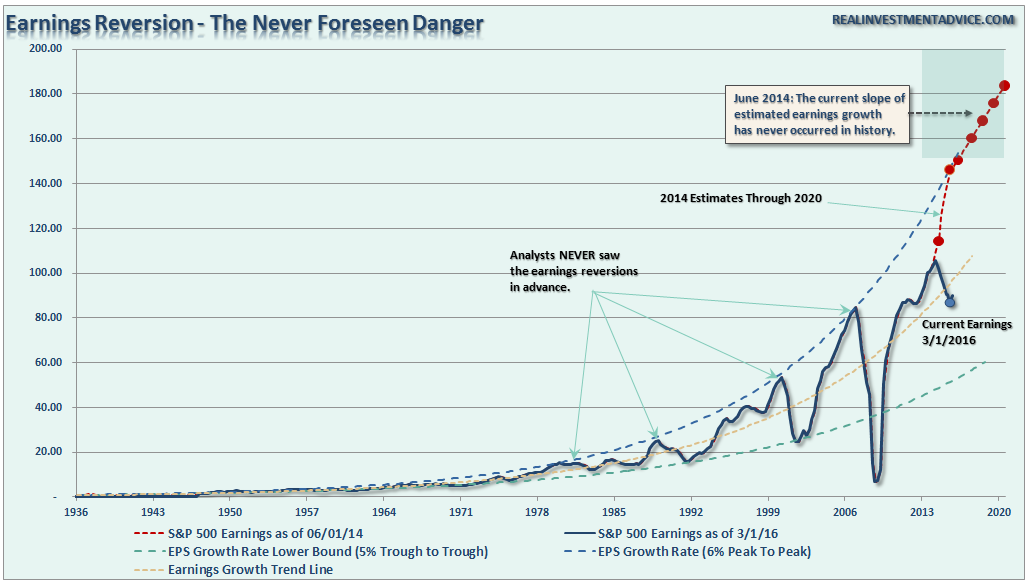
As I noted above, the drivers behind the growth in earnings are not entirely organic and have limitations to their efficacy. I have extended the chart to 2020 showing Jeff Saut’s extrapolated earnings growth trend. The idea of “permanent liquidity,” and the belief of sustained economic growth, despite slowing in China, Japan, and the Eurozone, has emboldened analysts to push estimates of corporate profit growth of 6% annually into the future. The problem is that such an earnings expansion has never occurred in history as it completely disregards the course of normal business and economic cycles.
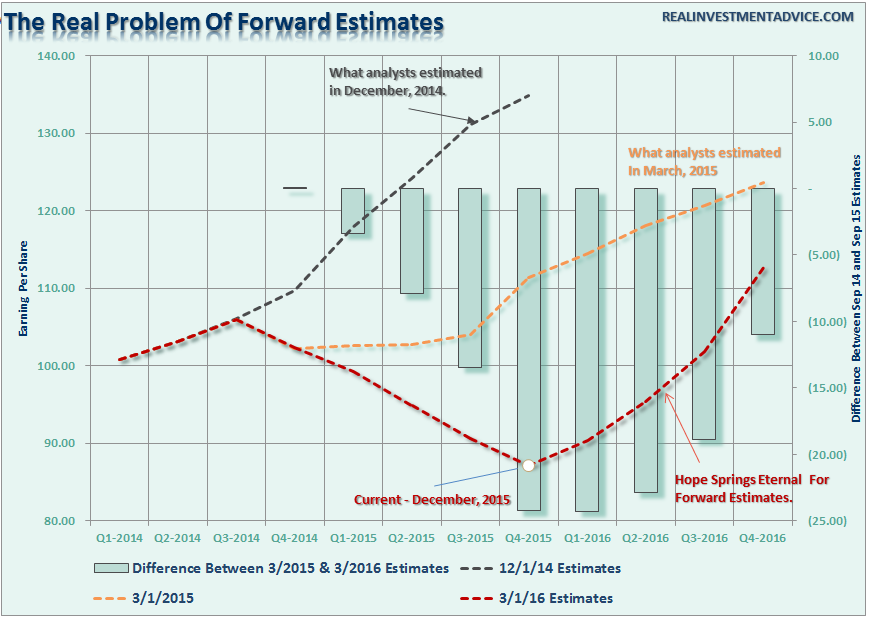
The problem with forward earnings estimates is that they consistently overestimate reality by roughly 33% historically. The chart below shows the consistently sliding revisions of analyst expectations versus the reality of corporate profitability. At the end of 2014, it was estimated that by Q4 of 2015 reported earnings would reach in excess of $131.00. However, Standard & Poors then revised down their estimates to just $104.03 at the end of Q1 in 2015. We are now looking at just $86.46 a share for 2015. What a miss.
But don’t despair, even though there is no sign currently of economic re-acceleration, estimates by S&P suggest a rapid upturn in earnings over the next 4-quarters. As is always the case, these estimates are likely to fall sharply as economic reality takes hold.
While there are many that suggest that “this time is different” due to accounting changes, Central Bank stimulus, and low interest rates, history suggests this unlikely to be the case.
Accounting Magic
What has also been stunning is the surge in corporate profitability despite a lack of revenue growth. Since 2009, the reported earnings per share of corporations has increased by a total of 206%. This is the sharpest post-recession rise in reported EPS in history. The problem is that the sharp increase in earnings did not come from a similar surge in revenue that is reported at the top line of the income statement. Revenue from sales of goods and services has only increased by a marginal 27% during the same period.

For profitability to surge, despite rather weak revenue growth, corporations have resorted to using debt to accelerate share buybacks. The chart below shows the total number of outstanding shares as compared to the difference between operating earnings on a per/share basis before and after buybacks.
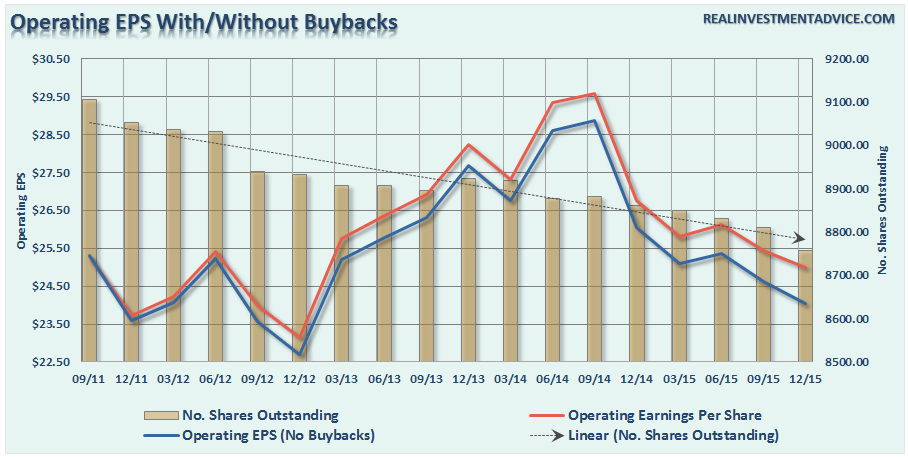
The problem now is that despite share buybacks, earnings are no longer growing.
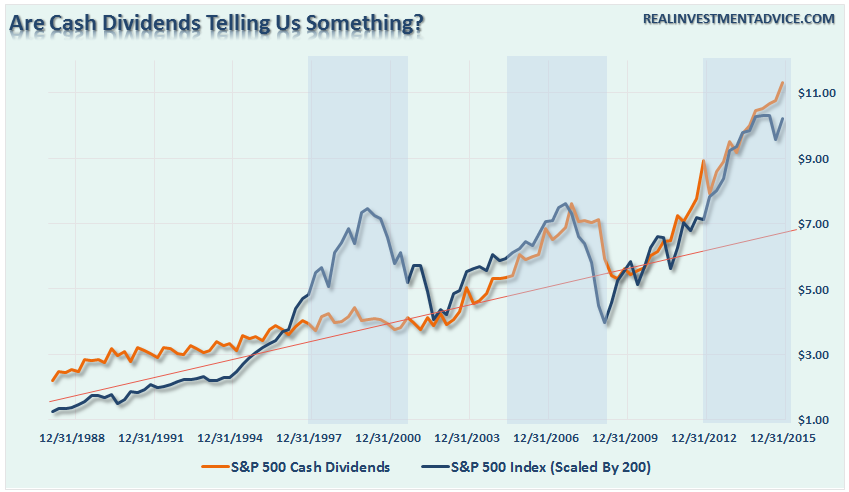
However, companies are not just borrowing to complete share buybacks but also to issue out dividends. According to the most recent S&P 500 company filings, the level of cash dividends per share have now reached $11.35 which is the highest level on record. It is also the greatest deviation from the long-term trend of dividends per share since the financial crisis (highlighted in blue.)
The reality is that share buybacks create an illusion of profitability. If a company earns $0.90 per share and has one million shares outstanding – reducing those shares to 900,000 will increase earnings per share to $1.00. No additional revenue was created; no more product was sold, it is simply accounting magic. Such activities do not spur economic growth or generate real wealth for shareholders. However, share buybacks and cash dividends provide the basis to keep Wall Street satisfied, and stock option compensated executives and large shareholders happy.
“There is virtually no ‘bullish’ argument that will currently withstand real scrutiny. Yield analysis is flawed because of the artificial suppression of interest rates.
It is the same for equity risk premium analysis. Valuations are not cheap, and rising interest rates will slow economic growth. However, because optimistic analysis supports our underlying psychological ‘greed,’ all real scrutiny to the contrary tends to be dismissed. Unfortunately, it is this ‘willful blindness’ that eventually leads to a dislocation in the markets.”
The current earnings declines are something worth watching closely. There will likely be a pick-up in economic activity in the first quarter of 2016 due to the “jiggering” of seasonal adjustments used to account for extremely cold winter seasons over the previous two years. Those adjustments will now statistically boost economic data due to the exceptionally warm winter in 2015. Those statistical anomalies will likely be ephemeral and could push the Fed into making a policy mistake by hiking interest rates further.
Lastly, as I noted in this past weekend’s newsletter:
“The technical chart below shows earnings capped at the ‘prior peak’ of earnings growth as compared to the S&P 500. Future outcomes have not been kind.”
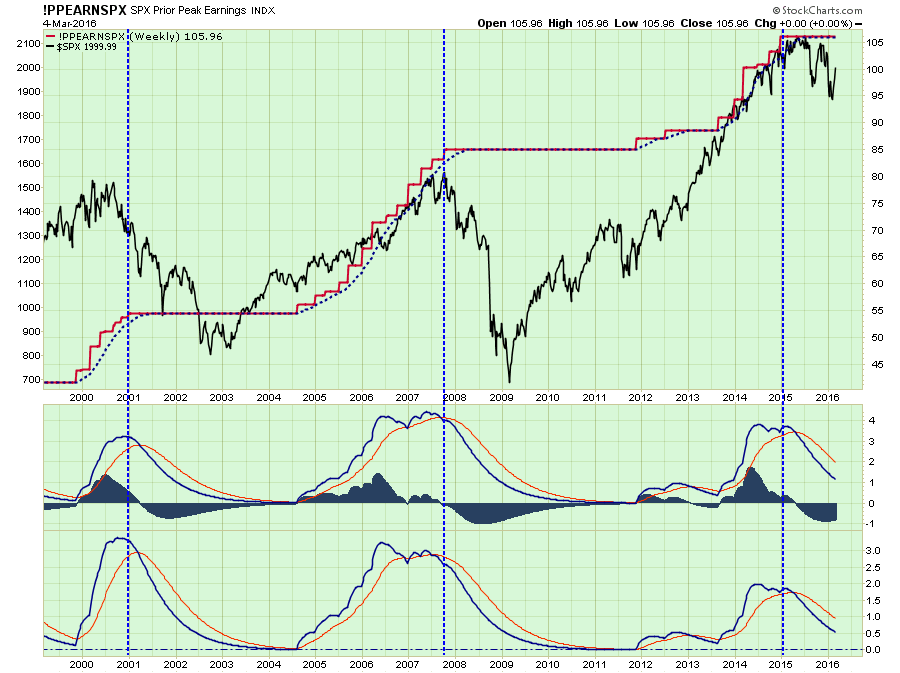
“The point here is that while markets have bounced as of late, a major underpinning of future stock prices is still negative. Until a change to the positive begins to occur, the probability of lower prices continues to outweigh the possibility of higher ones.”
While the markets keep hoping for further central bank interventions to keep the game going, the real issue may be the limits of manipulation have been reached. If that is the case, the “bullish case” may have a problem.
Lance Roberts

Lance Roberts is a Chief Portfolio Strategist/Economist for Clarity Financial. He is also the host of “The Lance Roberts Show” and Chief Editor of the “Real Investment Advice” website and author of “Real Investment Daily” blog and “Real Investment Report“. Follow Lance on Facebook, Twitter, and Linked-In

