
By Jim Quinn at The Burning Platform
“Facts do not cease to exist because they are ignored.” – Aldous Huxley
……..The BLS reported 321,000 jobs added in November and the unemployment rate at 5.8%. Jobs are plentiful, based upon these statistics.
A skeptical critical thinking individual might ask a few questions or point out a few inconvenient facts the government purveyors of propaganda might not want us to ponder:
- The non-manipulated, non-seasonally adjusted number of jobs in November FELL by 270,000. The BLS added 600,000 jobs as an adjustment to achieve the headline grabbing result.
- If the jobs market is so good, why is the labor participation rate at a 30 year low of 62.8%?
- Since 2007 the number of working age Americans has risen by 17 million, while the number of employed has risen by less than 1 million, but the unemployment rate is about the same.
- Why would almost 14 million working age Americans leave the labor force since 2007 if the economy is booming and jobs plentiful, with 1.2 million leaving in the last 12 months?
- Why would payroll tax receipts be flat with last year if millions of new jobs have been created?
- If the country has really added 8 million jobs since 2010, how could real median household income FALL by 2.3%?

According to the government reported figures, the economy hasn’t been this strong since 2007. GDP has supposedly grown at greater than 4% over the last two quarters.
Anyone who is sentient knows consumer spending accounts for 68% of GDP. Capital investments that lead to long term prosperity continue to decline as a percentage of GDP from 20% in 2000 to 16% today. We’ve chosen consumption and financialization over savings and investment. This fact leads to some observations:
- If GDP has actually grown by 20% since 2008 how does this correlate with a 6.9% decline in real median household income?
- GDP has been goosed by a $69 billion increase in government spending, with the majority going to the military industrial complex. ISIS has been a godsend for our GDP and arms dealer profits.
- GDP was increased retroactively by $500 billion last year based on a new way the government accounts for intangibles.
- The surge in consumer expenditures over the last two quarters has been in the purchase of services. The higher costs for Obamacare are a boon for GDP. Are they a boon for your bank account?
- The trade deficit has fallen as exports of petroleum products have temporarily provided a boost to GDP. The collapse in oil prices will reverse that trend rapidly.
According to the quasi-governmental mouthpieces at the Conference Board, consumer confidence is near a 5 year high, reflecting what should be robust spending.
So we are told by the representatives of corporatism that we are confident about the economy and the future. How does that measure up to the facts on the ground:
- Black Friday weekend sales collapsed by 11% versus the previous year. As the pundits tried to blame it on on-line sales (10% of total retail sales), Cyber Monday also proved to be a dud.
- If the average person is confident about the future and happy with their economic circumstances, why did they just vote to throw out the bums in November?
- If consumers are confident, why have real retail sales, excluding subprime debt goosed auto sales, been flat for the last three months and up only 1% in the last year?
- If consumers are so confident, why are credit card balances still $138 billion BELOW where they were in 2008? If all these new jobs are being created why is credit card debt lower than it was in mid-2010? Maybe consumers are so desperate they are using credit cards to pay utility and tax bills and not using them for frivolous Chinese crap at big box retailers.
- The increased spending at grocery stores and restaurants is driven by food inflation, not foot traffic. Discretionary spending at furniture, electronics, and sporting goods stores is flat.
- Department store sales continue to fall. Sears and JC Penney teeter on the verge of bankruptcy. Delia’s is liquidating and Radio Shack isn’t far behind. The major chains have completely stopped building new stores. The great bricks and mortar unwind relentlessly plods forward. In addition, online growth is stalling as states implement sales taxes.
According to the government, the deficit was ONLY $483 billion in 2014.
This is a real doozy. Obama has been touting how he has cut the deficit through his wise management of the budget. This is where government accounting is used by apparatchiks to mislead the public and obscure the truth. A few pertinent facts are always left out by the politicians touting deficit reduction:
- Because of the budget impasse in 2013, the Federal government stopped updating the national debt on a daily basis, but we know from when they started counting again, the debt went up by $2.3 billion per day. Therefore, the national debt on October 1, 2013 was approximately $17.038 trillion. On October 1, 2014 the national debt was $17.875. Therefore, the national debt went up by $837 billion in 2014. Just a smidge higher than the reported deficit of $483 billion.
- Interest is not paid on reported deficits. It’s paid on the national debt, so the massaged, manipulated and made over deficit is meaningless. The national debt was always slightly higher than reported deficits, but in the last few years the deviation has grown to a Grand Canyon size.
- The deficit number has been artificially lowered by nothing other than accounting entry hocus pocus. The Federal Reserve increasing its balance sheet to $4 trillion out of thin air creates approximately $80 billion of phantom interest profits that are paid to the Treasury. Why don’t they increase their balance sheet to $40 trillion and eliminate deficits all together?
- The biggest accounting scam is Fannie and Freddie. Just as the Wall Street banks have created fake profits through accounting entries regarding future losses, Fannie and Freddie have gone the extra mile in helping fake deficit reduction. These bloated insolvent government run pigs required a $187 billion taxpayer bailout in 2009. Amazingly, when you allow criminals to value their assets at whatever they choose, phantom profits flow like honey.
- These two horribly run institutions of fraud “generated profits” of $129 billion in 2014 which were “paid back” to the Treasury. That is four times more than Apple or Exxon’s profits during a non-existent housing recovery. Why are their stocks trading at just over $2 per share if they are generating vastly more profits than they were in 2007 when their stocks were north of $70 per share? It’s because the profits are fake. Everyone knows it, but the Federal Deficit is reported $129 billion lower because these insolvent entities pretended to pay the taxpayer back. Accounting entries do not reduce deficits. Spending less than you generate in revenues reduces deficits.
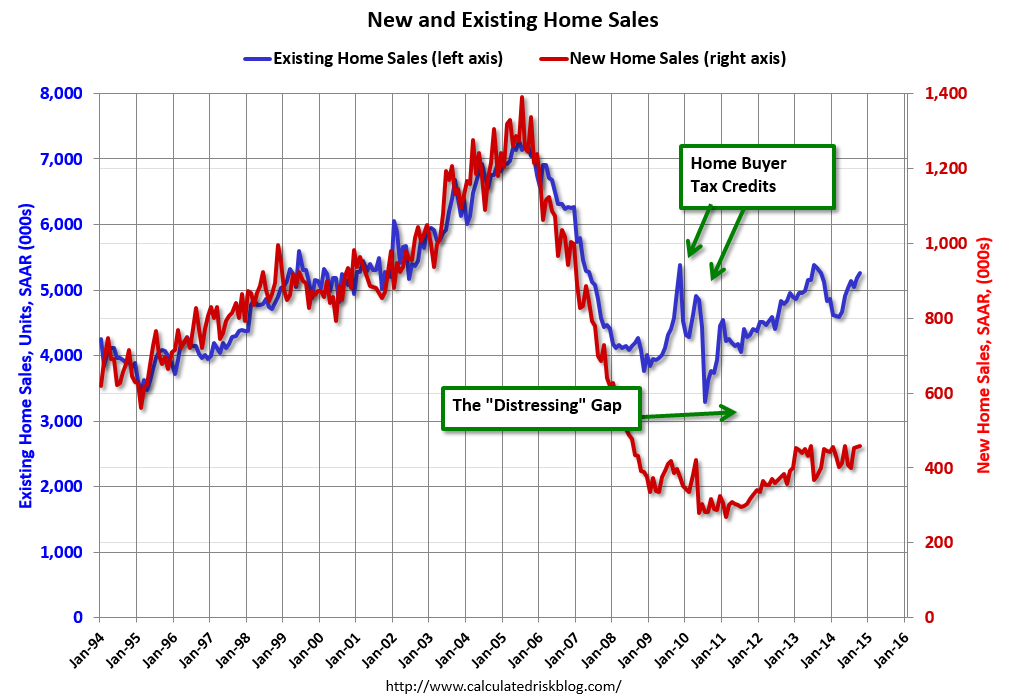
According to the government, we’ve experienced a strong housing recovery since 2010.
The supposed housing recovery storyline continues to be beaten like a dead horse by the Wall Street media (CNBC) and the shills at the NAR. Anyone with a functioning brain (eliminates CNBC bimbos, hacks, and Ivy League economists) can see there has been no real housing recovery:
- The 24% rise in home prices (Case Shiller Index) since the 2012 low has been nothing more than a Wall Street hedge fund/Federal Reserve scheme to elevate prices and make Wall Street bank balance sheets less insolvent. Wall Street banks withholding foreclosures from the market while Wall Street hedge funds (Blackstone) use free money from the Fed to buy up housing and rent it out to former homeowners has enriched the .1% while destroying the dream of home ownership for millions.
- The percent of first time home buyers remains near record lows, while speculators, flippers, hedge fund managers, and rich Chinese businessmen make up a record number of purchasers. The fact this is a fake housing recovery is proven by mortgage applications to purchase a home sitting at 1995 levels and 30% below 2009 recession lows. Maybe the fact real median household income is also at 1995 levels, real wages keep declining, and labor force participation is at 1978 levels has something to do with real people not being able to purchase a home.

- Even with the artificial hedge fund demand, existing home sales are lower than 2013 and languishing at 1999 levels. They are still 25% below 2005 levels, despite the lowest mortgage rates in history. New home sales are a disaster, with no appreciable increase in two years. Apartment construction has far outpaced single family housing construction. After a five year housing recovery, new home sales languish at levels seen at the bottom of our last six recessions. New home sales are 65% below the 2005 peak and at levels seen in the early 1960’s when there were 130 million less people living in the country.
According to the corporate media, the auto market is hitting on all cylinders with annual sales of 16.4 million, the highest since 2006.
Pretending to sell automobiles to people without the means to pay you for the automobile is always a good business idea. Of course, when you have Ally Financial and the rest of the Wall Street banking cabal doling out 7 year 0% loans and subprime auto loans like candy, it’s easy to move inventory. The temporary boost to GDP by issuing more bad debt always works out in the long run. Right?
- If the auto business is booming why have GM profits fallen from $9.2 billion in 2011 to $5.4 billion in 2013, and on course to fall to $4 billion in 2014? Record levels of channel stuffing produces sales gains, but no profits. Why is their stock 25% below its 52 week high and lower than it was in 2010 when it was IPO’d after being rescued by Obama?
- If the auto business is booming why are Ford’s profits falling by 35% versus last year and lower than they were in 2010? Why is their stock price 16% below its 52 week high and still 20% below its 2010 price?
- Auto loan debt is at an all-time high of $950 billion, up 33% since 2010 when the Fed, Wall Street, and the political class in the fetid D.C. swamp decided they needed new debt bubbles in auto loans and student loans to jump start our moribund economy.
- There are 65 million auto loans outstanding, and the average debt now stands at $17,352. Over 30% of auto “sales” are actually leases. The rest are financed over an average of 65 months. Virtually all new car sales are nothing more than 3 to 7 year rentals. It’s amazing what easy money from the Fed can produce.
- Over 31% of all new auto loans this year were to subprime borrowers. They now account for 36.5% of all outstanding auto loans. You become a subprime borrower by defaulting on previous debt obligations. In a shocking development, auto loan delinquencies surged by 13% in the last quarter, with subprime loan delinquencies skyrocketing by 18%. When has issuing billions of debt to subprime borrowers ever caused problems before?
- Only a University of Phoenix African Studies major is more of a subprime risk than the millions of ecstatic Escalade drivers cruising around our urban ghetto paradises. The average student loan debt is now $33,000. Until the Obama administration went Keynesian, student loan debt was primarily in the private sector. When Obama entered the White House total student loan debt was $620 billion and delinquencies totaled $50 billion. There are now $1.3 trillion of student loans outstanding, with the Federal government accounting for $830 billion and guaranteeing a large portion of the rest. Delinquencies have skyrocketed to $125 billion, as another taxpayer bailout beckons.
According to the corporate mainstream media pundits, the plunge in oil prices from $100 per barrel to $61 per barrel is unequivocally good for the economy. The shale oil boom has worked its magic and happy times are here again.
Sometimes you have to wonder whether the highly educated spokesmodels on the corporate mainstream media are really as vacuous and clueless as they appear or whether they are just paid to look pretty and mouth the corporate line. They seem incapable of comprehending the unintended consequences of various events. The collapse in oil prices is one of those events.
- There is no doubt that lower oil prices will lower the price of gas for the average American. Estimates say they will save $368 per year, which can be spent elsewhere. The highly paid shill economists who declare this will boost spending seem to be math challenged. Retail sales figures include gas stations. What isn’t spent there will be spent in another category, most likely healthcare or groceries as prices in both areas continue to escalate. It’s a zero sum game. No new spending will occur.
- The worldwide supply of oil has only increased marginally over the last few years. The U.S. shale boom has been offset by declines elsewhere (Libya, Iran, Mexico). The reason for the collapse is the same reason for the 2009 collapse – worldwide demand is contracting. Europe is in a depression. Japan is in a depression. Russia’s economy is contracting. China is decelerating rapidly. The U.S. demand is flat. The implications of another global recession after five years of central banks printing trillions of fiat currency are alarming to say the least.
- The cost to extract shale oil and transport it to a refinery capable of processing it is high. Honest analysts will tell you that a price of $70 to $80 is required to breakeven. Most companies don’t build breakeven into their plans. Bakken shale oil sells at a discount of about $14 per barrel due to the difficulty of extraction, transport, and processing. It is now selling for $47 per barrel. The number of permits for new rigs fell by 40% in November when oil was still selling for $75 per barrel. Do you think permits for new wells will fall at a price of $61 per barrel? Capital spending by the energy industry accounted for 33% of all capital spending in the last few years. I’m sure some other industry will pick up the slack. Right?
- It seems the shale oil boom has resulted in a few jobs being created since the 2010 recession trough. In fact the states where fracking is prevalent have accounted for all the job growth in the nation. I wonder if a shale oil bust will have any employment implications. There are 9.3 million jobs related to the energy industry across the country. The plunge in oil prices created by Saudi Arabia in the 1980s created a depression in Texas which contributed to the S&L crisis. This plunge will reveal who has been swimming naked in the high yield bond market and derivatives market.

http://www.theburningplatform.com/2014/12/11/should-you-believe-what-they-tell-you-or-what-you-see/

