
When I started in this business more than twenty years ago, I fully expected to be a profession investor in the purest sense of the term. I envisioned spending my days tearing apart corporate financials, especially balance sheets, and matching them to common sense expectations of new products and imaginative advances. It was the 1990’s, after all, and everything seemed new even if it was all suddenly devoid of healthy skepticism. That was investing as almost everybody understood it.
The dot-com bubble was a radical awakening. For me, I began an intellectual deviation sometime before even if I wasn’t nearly experienced (or smart) enough to anticipate what was coming. Inside certain companies’ balance sheets (financial) and among various data components I ran across details like “repurchase agreements”, “eurodollar deposits”, and “securities lending.” All those pointed in a very different direction than the orthodox training they give you in school; classes that make no mention (or very little) of any of those things and certainly not in a context where they make sense.
I am not an economist nor have I ever been. I have been a portfolio manager first and foremost but with a specialty in research. It is the interest in research that demanded figuring out more than what the narrow views of the orthodox world would tell me. The dot-com bust was the catalyst, and ever since then I have been moving further and further away from being an “investor” and more and more toward redefining the world in such a way that it actually makes sense. To the orthodoxy, the dot-com bubble was an anomaly, something that never really made sense so it just isn’t discussed except to find new ways to dismiss it (and each bubble so far thereafter).
Rather than spend my days contemplating stock picks or relative values as any purely investing professional, I am left to plumb the depths of long dated multi-currency swaptions and how they find their way through Tokyo to China and back again, and all through and around what is supposed to be the dollar. Fortunately, I have partners here at AIP who still try to be investors in the conventional sense so that I can be left to try to figure out the risks of undertaking that effort. Systemic risk as I understand it is a monetary regime unlike anything seen before, and one that is perpetually denied by those who aren’t supposed to deny any monetary observations, so that they can continue to wholly influence what the mainstream itself can and can’t deny.
The consequences of this divergence aren’t strictly asset bubbles, and thus the risks to investing aren’t strictly monetary. There is always a fundamental background baseline to it, even if, as my colleague Joe Calhoun (rightly) points out again and again and again, there is no law or expectation that markets and the economy have to align in at least the short run. The eurodollar system, then, has delivered investors both monetary problems and economic.
Recognizing a radically different worldview invites more comprehensive skepticism right down to the very root, especially where certain areas or factors don’t agree or corroborate. If it doesn’t make sense, there is no longer any room to simply dismiss or ignore it; complete investigation is not optional. Unfortunately, there has been no shortage of questionable narratives, accounts, or even statistics. The basic construction of each economic data point is immediately under suspicion based on nothing more than the fact that the world of the eurodollar is wholly unlike the world in which these statistics were developed. It is the inherent weakness of any stochastically-based regime, as it assumes right from the start that the future will look like the past. The eurodollar was a “tail event” to these probability distributions, one that permanently altered almost everything.
When the Census Bureau declares, as it did yesterday, that new orders for durable goods (minus transportation goods) to be produced in the United States in April 2016 totaled $148.877 billion, the media reports it as if that were the actual amount of new orders. In reality, we don’t really know what has happened in April 2016; the media simply assumes that all the statistical processes that were used to come up with that figure were accurate in parts and in whole – that it is an assumption is never relayed.
At the start, durable goods “new orders” aren’t even a major emphasis on the M3 surveys; it is computed backwards by adjusting the month’s total in shipments by the change in backlog. Only some companies in the survey panel report a separate “new orders” category, which the Census Bureau uses for “data editing.” That is where all these numbers come from, a sampled panel subset of the entire manufacturing universe.
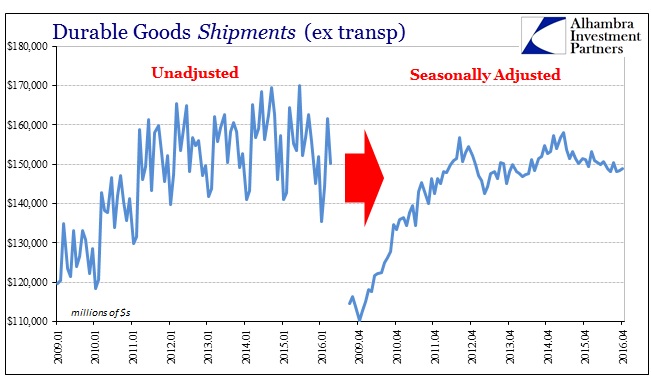
Thus, the $148.877 billion seasonally-adjusted is actually derived via the ARIMA X-13 SEATS algorithm from $150.134 billion in “unadjusted” durable goods new orders. From time to time these seasonal adjustments cause some minor stir and garner a little attention, but there is none at all paid to the fact that the “unadjusted” data itself is inappropriately classified that way. The term only applies with respect to seasonality; apart from it being one step prior to the ARIMA X-i, there are a whole lot of adjustments that take place to come up with the $150.134 billion.
Again, the Census Bureau does not directly survey every single manufacturing outfit or subsidiary in the United States; not that they don’t try to be as comprehensive as humanly possible. When the M3 (Manufacturers’ Shipments, Inventories, and Orders) series was started in 1962, the Bureau’s original panel included all companies with more than 1,000 employees along with smaller firms “selected with probabilities proportional to their employment size within each industry category.” By 1975, the response rate of mid-sized companies (with between 100 and 1,000) had dropped significantly to the point that the Bureau selected just 1,000 businesses in this group to be included in the panel – and still only got a 60% response rate from them.
By 1987, the sampling universe had fallen further as this paper details:
The present M3 survey panel consists of approximately 4,100 reporting units. The original panel included virtually all companies with 1,000 or more employees and a sample of the smaller companies. Over time, we have deleted companies that refused to report from the mailing panel. At present, most of the companies with 2,500 or more employees, about half of those with 1,000-2,499 employees, and less -than one-third of the sample selected for the 100-999 employee group are reporting in the survey. There is no representation of companies with fewer than 100 employees.
As you can see, the sample universe skews decidedly toward larger businesses. To counteract the decreasing and relatively small sample size in the monthly estimates, the Census Bureau undertakes a more comprehensive annual review. Each year, the M3 is given a boost by the Annual Survey of Manufactures (ASM) and then every five years the Census Bureau undertakes the massive Economic Census. The idea is simple, to use incomplete data in the high frequency monthly reporting until such time as more comprehensive sampling can be conducted and digested.
But what happens at each monthly update is very different than how it is presented. The Census Bureau does not estimate the level of durable goods orders, inventories, or shipments each month, but only takes its sample to figure monthly variation.
The emphasis in the survey is on percent change from the previous month rather than on estimating levels for the current month. The monthly estimates of shipments, unfilled orders, and total inventories are ratio estimates, derived for industry category by multiplying the industry estimate for the previous month by the percentage change from the previous month for companies reporting in the current month.
This is why benchmark revisions can be so radical at times. It is the combination of all the statistical processes that go into estimating only monthly variation from a small and rather skewed subset and checking it as more complete data becomes available with which to remove those biases. The Census Bureau is very upfront about it:
The M3 survey data are benchmarked to reduce both sampling and nonsampling errors. The relatively small monthly sample size as well as the differences that result from collecting the monthly data on a divisional basis as compared to the benchmark data on an establishment basis account for most of the revision.
The Economic Census is the big one, with the largest and most complete universe including small businesses that is, essentially, the benchmark of benchmarks. This is entirely upside down of how this data is presented to the mainstream; the monthly numbers are given almost total deference as if they are true representations when it should be the benchmarks that receive most consideration but those are never, ever mentioned. There is some innocence to the transgression, however, as the Census Bureau (and all data agencies) had until the 2010’s done a very good job in maintaining consistency even in the high frequency data; there was no obvious reason to question durable goods in the 1990’s or even middle 2000’s as the stochastic estimates at least conformed to the general view of the economy. Since the Great Recession, though, the continued reversed esteem is at least laziness if not something worse.
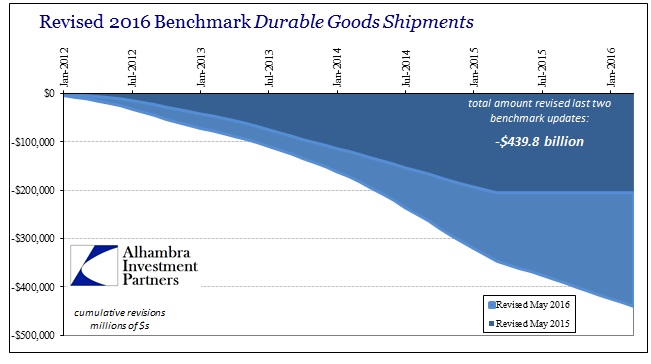
That is especially true when there are drastic changes at the benchmarks. As I wrote today:
With economic accounts reporting only variation, that leaves open any number of ways in which error might be introduced, as well as a great deal of time during which those errors might propagate. The last Economic Census was taken in 2012, but its results didn’t start to find their way into the benchmark data flow until the middle of 2014 and really throughout 2015. Unlike prior editions, the 2012 update is proving to be absolutely stunning.
Indeed, as noted previously, the 2012 Census has been like a bomb going off inside these data series. In many ways that should have been expected since the economy of 2012 was radically different than the economy of 2007 when the prior Economic Census was taken. Among the most confounding aspects of this change in “recovery” has been how it has left behind particularly smaller firms – often in sharp contrast to what is found of the biggest businesses. Though all firms are struggling now, in the middle part of this slowdown there was undoubtedly a size bias covered up by the panel/sample bias.
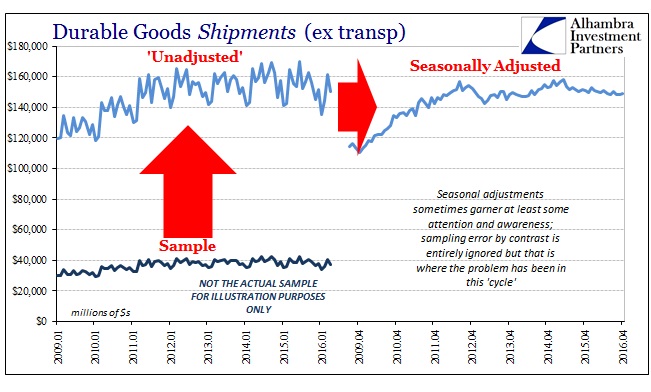
We have seen this problem in other ways in other statistics, notably the continually unanswered questions surrounding the BLS’s so-called birth/death model, but that is not the only bias increasingly evident in turning the sample respondent results into the “unadjusted” data series. Another one is trend-cycle, and that may be, as I would argue, the biggest problem in all these statistical processes, primarily because the regressions “expect” this cycle to be consistent with all prior cycles even though it so clearly isn’t or ever was. They take the sample results and “compensate” in mathematical fashion so that the “unadjusted” series at least follows the general contours of what a recovery cycle “should” be like.
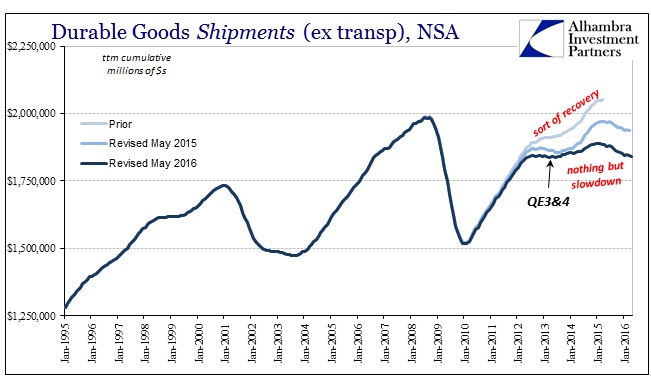
With the “benchmark of benchmarks” now flowing into these accounts, the view of the economy is radically altered to match the radically different world that was always there; the 2012 Economic Census is correcting a great deal (and we don’t know really how much even now) of all those prior biases. The results are stark, but wholly ignored by the whole of the mainstream – as if nothing has changed at all even though the recovery, especially in these consumer accounts, just disappears.
It is not just durable goods or the Census Bureau. Industrial production is prepared and published separately by the Federal Reserve, and its most recent benchmark updates for whatever it has been sampling are nearly identical to durable goods: 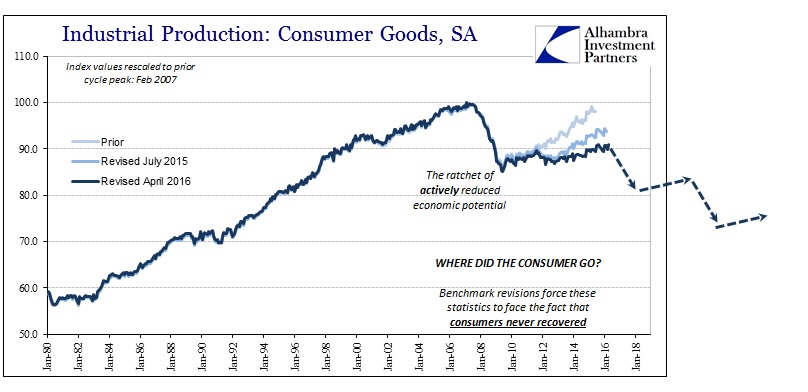
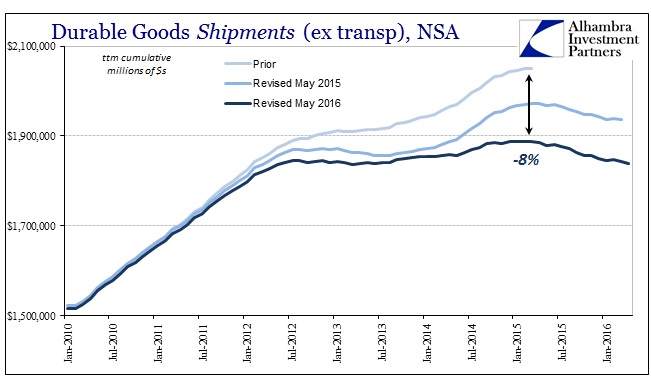
This is why I have been arguing for years that economic accounts, particularly the labor numbers which have yet to be reckoned with, have been overstated and maybe even highly so – they were almost made to especially in these kinds of circumstances where economic reality does not follow closely if at all prior cyclical trends. And so investing has to now include estimating risks of economic data construction leading to very reasonable suspicion that mainstream accounts have been producing highly misleading figures. Just on those charts above, the trend before the 2012 Economic Census was added looked like a plausible recovery, slow but conforming in at least the outline.
The revisions, however, remove any thought of progress, let alone recovery and “overheating.” The pre-2015 benchmarks suggest a much more comforting if still concerning future; the new benchmarks leave us to ponder almost exclusively some really bad scenarios, especially as they confirm some very negative interpretations about monetary risks going all the way back to August 9, 2007.
We are truly cursed to live in such interesting times, when established economic data becomes (almost) as suspect as the monetary regime itself, with one very much related to the other. I could never have imagined I would end up spending so much time and effort critiquing the Census Bureau, but that was only because the orthodox world believes, and makes those within it believe, that it knows all that is worth knowing right down to the most basic measurements.

