
The coming turmoil in the US Treasury’s bank account at the Fed will have a huge impact on bond prices in particular, and thus yields. It will also have an impact on stock prices that won’t be pretty. The good news is that we already know exactly how the turmoil will play out. We just don’t know the timing yet. But it will become apparent in time to act.
Meanwhile, growth rates of key banking indicators are collapsing and one critical indicator is in the middle of an outright crash. These measures suggest big trouble ahead for the markets.
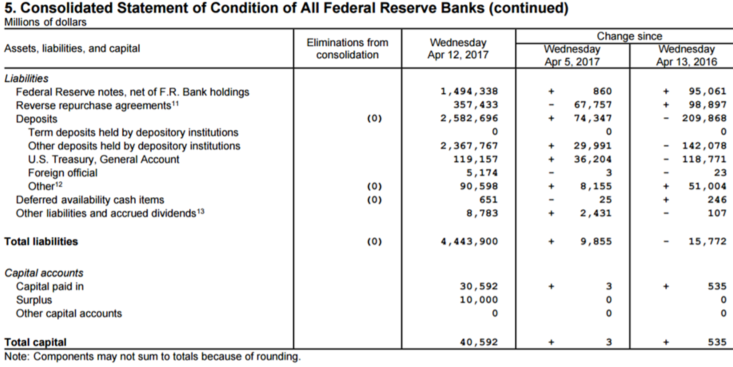
Fed Liabilities
As of April 12, 2017, the US Treasury’s deposits at the Fed totaled $119.2 billion. This was an increase of $96 billion from 4 weeks before. That followed a drop of $222 billion from the February 8 Fed H41. In February and March, Trump couldn’t spend the money fast enough. This month the Treasury has been piling up cash.
Corporate year end taxes were due on March 15. The Treasury processed and deposited them over the following week. Then in April, individual income taxes start to come in. The bulk of that will come after April 17 when taxes are due this year. The Treasury will gain some breathing room from these receipts, after running its cash down to a dangerously low level in early March.
The problem now is that the debt ceiling means that new borrowing will need to stop. The Treasury will need to spend all the cash in its account at the Fed without being able to borrow to supplement that cash. At some point in May the Treasury will have no more cash and no ability to borrow from the market. I don’t know how long it will take before the internal accounts that the Treasury is raiding to pay bills, like government employee pensions, are gone. I have seen estimates ranging from June to September. I suspect it will be earlier rather than later.
Here’s why that’s critical to the market outlook. For now, the Treasury can’t add new supply to the market as it normally would every month. That means that the cash coming into the US from the money being printed in Europe and Japan for their QE programs will not have the usual supply of bonds to purchase. At the same time, the Treasury may even pay down debt for a couple of weeks, using the tax windfall.
Even if the Treasury elects to hold on to the cash and simply use it to pay bills rather than pay off debt, it’s bullish for securities, which for now means bonds. Stocks have suddenly become the whipping boy, so bonds are getting all the benefit of the drop in bond supply.
But then everything reverses when the Treasury finally runs out of cash. That will be a political flashpoint. After some strutting and posturing by President and members of Congress, a deal will get done.
The Treasury will then start borrowing hand over fist to repay the accounts it raided and to replenish its cash. The bond market rally now under way will abruptly reverse, and all the recent gains are likely to disappear in an instant. Stocks will also probably come under pressure given the onslaught of new Treasury supply that will follow a deal to raise the debt limit. There simply will not be enough cash around to support stock prices. As the debt ceiling impasse builds to a crescendo and the news of negotiations toward a deal builds, it will be time to sell your bonds.
Bank Loans Outstanding
Bank loans fell in March for the third straight month. The 3-month decline has ended a nearly 4-year string of all time records each month. The annual growth rate fell to 3.6% as of March 29. That’s down from 6% in December. It continues slowing growth that has steadily come down from 7.4% in September of last year. The growth rate had been between 7% and 8.5% from December 2014 until last September.
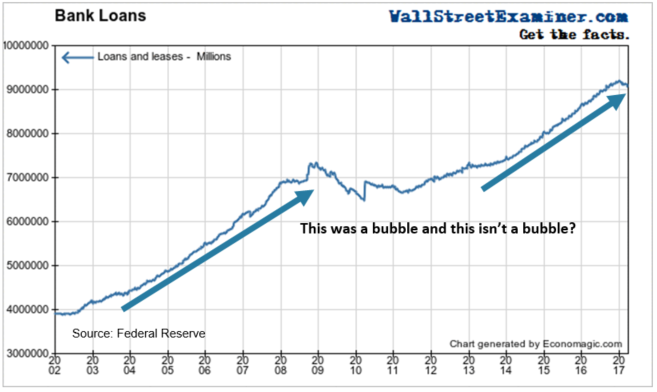
This is starting to look like a trend change. Some of the speculation that had driven the economy and the markets has bled off and seems likely to continue to bleed off. This is a bearish sign for the stock market. The bull market has been driven by free and easy credit. The free part is going away. With the Fed beginning to talk about shrinking its balance sheet, the easy part won’t be so easy. The Fed is pulling the Easy Button.
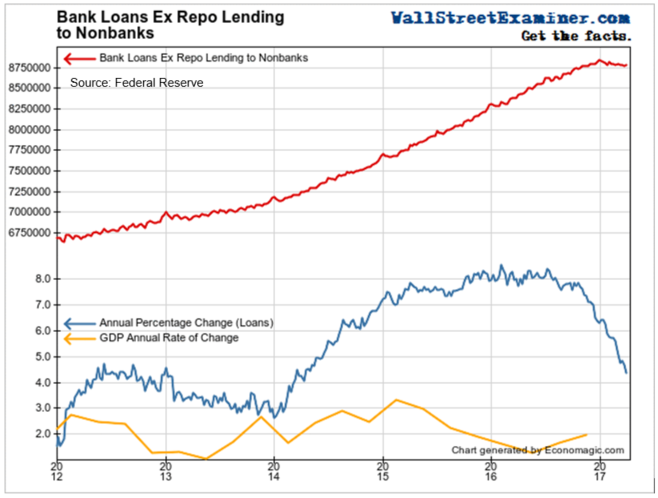
Lending not related to financing securities holdings includes both consumer lending and commercial and industrial lending, but excludes securities financing. These loans fell in March for the third straight month. A slight decline is common for the first month or two of the year, but the current decline has extended past the norm.
The annual growth rate has been slowing dramatically. It has now dropped to 4.4% from nearly 8.5% in mid year 2016. The current growth rate is still greater than the growth rate of the economy. But the rate and persistence of the slowdown is greater than any decline since the recession bottomed in 2009.
Loans outstanding have now been declining for a full quarter. That hasn’t happened since the current bubble lifted off in 2011. The air is now coming out of the credit bubble that has driven the markets berserk on the upside.
In Part 2 of this report, we’ll look at additional banking indicators that graphically show the extreme risk building in the markets.
This report is derived from Lee Adler’s Wall Street Examiner Pro Trader Monthly Treasury Supply and Demand Report.
Lee first reported in 2002 that Fed actions were driving US stock prices. The US Treasury has also played a role in directly moving markets. Lee has tracked and reported on those relationships for his subscribers for the last 15 years, helping to identify major turning points in the markets in their earliest stages. Try Lee’s groundbreaking reports on the Fed and the Monetary forces that drive market trends for 3 months risk free, with a full money back guarantee. Be in the know. Subscribe now, risk free!

