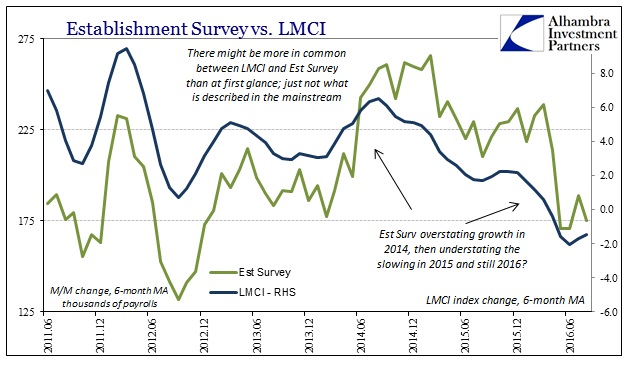
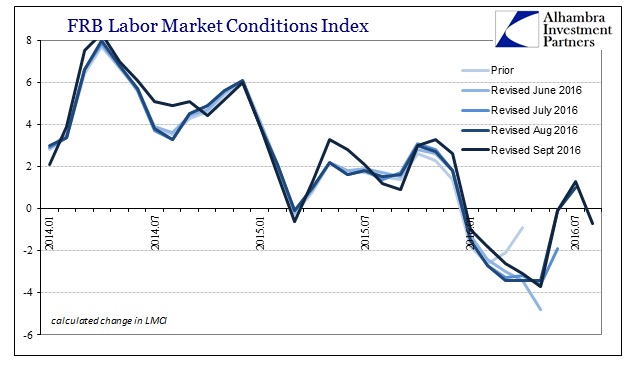
The Federal Reserve’s Labor Market Conditions Index (LMCI) fell to contraction again in August. After rebounding in July for the first positive reading of 2016, the LMCI dropped to -0.7 in the latest update. As usual, revisions have reshaped the levels of indicated problems throughout the past two years, but overall the trend remains. From this view of the labor market, the economy is surely slowing even if taking two years to suggest by how much.
As I wrote earlier today, I believe that is the natural tension between an economy that “wants” to grow but can’t due to monetary suppression. This is nothing to do with quantitative easing or “stimulus” in broad terms, except that it further shows that no form of central bank policies has had the effect of increasing the money supply to the real economy.
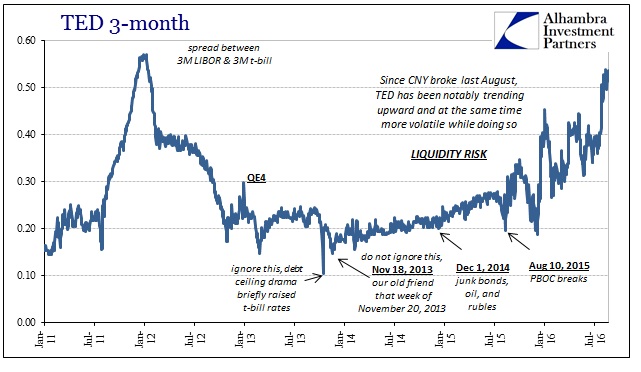
What Friedman actually meant, and what we can observe now, is that low interest rates indicate tight monetary conditions for the real economy. On that score there is no mystery about “tightness” so much that even labor statistics and the seemingly impenetrable services economy are now openly displaying it. You look at the TED spread and see that “something” changed in August last year; you look at the ISM Non-manufacturing PMI and sure enough, same thing. Where eurodollar decay had before cut a great deal off global economic growth (the depression), the “rising dollar” variant of it seems to be that much worse in that it is pushing the real economy into active deceleration and contraction (some places already alarmingly deep).
The LMCI, which is comprised of 19 often very different jobs market accounts, has clearly detected the effects of this “rising dollar” variant. Peaking in the summer of 2014 coincident to its first appearance, the LMCI has been decelerating and now contracting as each separate act of “rising dollar” symptoms further plagues and strains economic function.
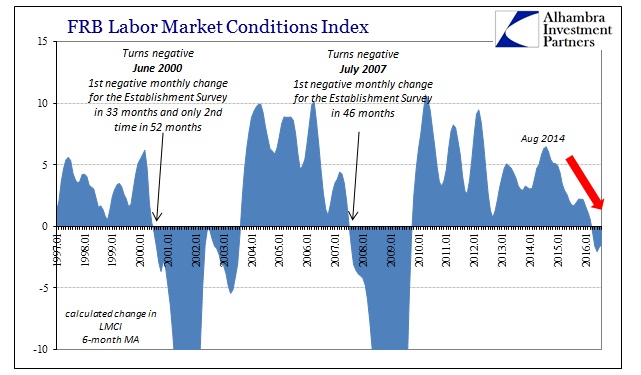
Though the index was itself created in August 2014, it was back-tested to align with prior economic signals for depth and occurrence as either growth or contraction. When the 6-month average turns negative for the month of July 2007, it was also the first month where the Establishment Survey contracts, too. The same was also designated for the turn into the dot-com recession in summer 2000.
Therefore, if we attribute the lack of peak growth especially since 2012 to the eurodollar’s ongoing contraction, then it is difficult in that context to interpret what the current economic indications are suggesting. If this were a more normal cyclical occurrence, the stubbornness of the LMCI in contraction (as with so many other data series) would suggest cycle peak and recession. However, given the lack of cyclicality and the intrusion of monetary suppression, it may not be so straightforward.
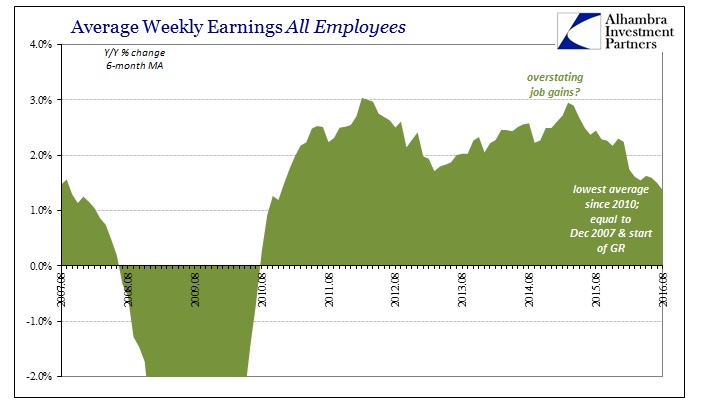
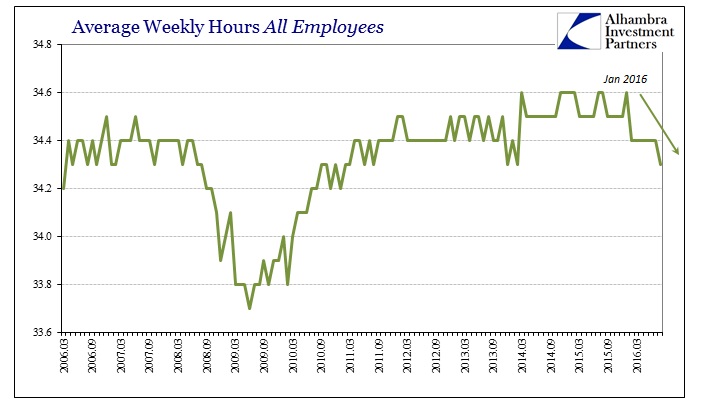
Because, however, the index is in near-consistent contraction and corroborated even by the clear slowing in both the Establishment Survey as well as the internals of the CES itself, it is reasonable to conclude that the current level of economic weakness is relatively more severe than even last year at this time. So even if we don’t know exactly where the economy is going and exactly how it will get there (though we still can’t rule out a recession-within-a-depression), we do know that it has progressed uncomfortably far so far and is still likely continuing in that same “wrong” direction.
In my view of the eurodollar system, that is perfectly consistent with monetary “strangulation” of the real economy.
