
Yesterday I reported that the sky may not be falling for new home sales yet, but that the dawn of destruction should show up in the November data. I mentioned that there’s a treasure trove of additional data in the Commerce Department’s New Home Sales release that paints a very grim picture. Let’s reach out in the darkness and take a peek.
These are perspectives that you will never see in the mainstream media or from your friendly street corner stock dealer who wants to keep selling to you. There’s a lot of mindblowing data here. You just need to know how to look at it.
First, we’ll look at the relationship between mortgage rates and sales volume, and between mortgage rates and house price inflation. I’ll post more in a followup post.
In yesterday’s report I showed just how badly sales are lagging population growth. Carrying that a step further, In theory, new home sales should be related to employment growth. But sales aren’t growing at a rate consistent with employment growth. That’s because most new jobs don’t pay enough to allow workers to afford a house. This is a long term trend that has gotten worse since the housing bubble popped in 2007.
On the basis of sales per million full time workers, sales are only at 361 sales per million in October. See the chart below. Today’s level is finally above the level they fell to at the bottom of the 1981-82 recession, but not by much. At that time, mortgage rates were at 18%. But back in October mortgage rates were around 3.4%.
That’s record help for buyers. But it’s probably all she wrote on that score. Today, rates are at 4.1% and long term yields are on the cusp of a major trend break that could send mortgage rates significantly higher.
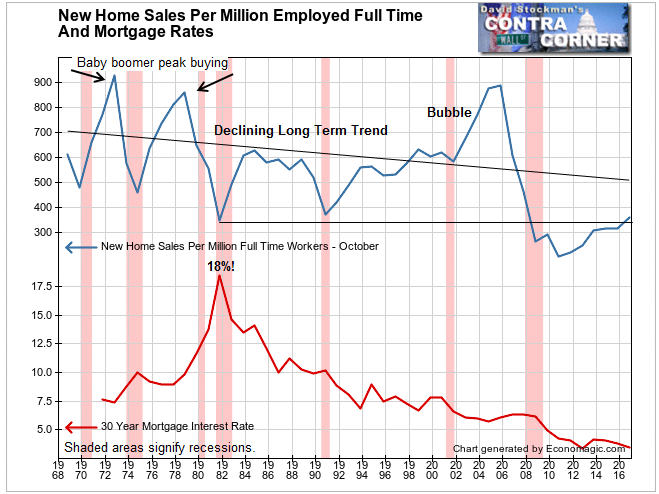
There are a couple of other things to worry about on account of the rate trend. The first is in regard to the big picture. The secular trend of new home purchases versus employment has been declining for nearly 50 years. At the same time, mortgage rates have been falling consistently with only minor interruption since 1982. Why hasn’t that trend of falling rates caused an increase in the sales trend?
There are two answers. First is that as mortgage rates fell, prices rose as fast or faster than rates fell. The buyer’s monthly nut did not get cheaper. It stayed the same or grew as house prices inflated.
The second reason is that over the past 20 years, and the past 10 years in particular, the growth in employee earnings did not keep pace with the housing inflation rate. There is no sign, nor any reason to believe, that that trend will improve any time soon. We’ll take a closer look at this issue in a subsequent report.
That minuscule recovery off the all time low in sales in 2010 came with the tailwind of mortgage rates falling from 4.4% to 3.4% twice. The last time mortgage rates were at the current level of 4.1% was in October 2014. Sales were only at 316 per million workers then. That would imply a fall in sales from the current level of 361 back to the trendline from the 2010 low, which is currently around 310-320.
Any rise in mortgage rates beyond 4.1% would probably trigger an outright decline in the rate of sales below the 6 year uptrend. Housing would go back into contraction.
Some observers may argue that rising rates now would trigger an increase in sales as would-be buyers who had been holding off buying would now rush back into the market. I’ve experienced that personally as a real estate salesman back in the late 1970s.
It is unlikely that that scenario would repeat today. Back in 1978, wages were inflating just as fast as home prices. Buyers could still qualify to purchase until rates really began to squeeze buyers in 1979. Once rates crossed that threshold sales collapsed.
Contrast those conditions with today. New home prices have been rising much faster than household incomes. It was only the decline in mortgage rates that kept the monthly payment low enough for the existing numbers of buyers to qualify. A rise in rates without an offsetting decline in prices today would force borderline buyers out of the market.
The median sale price in October was $304,500, a gain of 1.9% year to year. This came after a similar year to year increase in September and a decline of –2.1% in August.
The slowdown this year follows a flat year in 2015. New home price inflation has stalled. The affordability problem should bring the current bubble to an end.
Just as weak income growth and high prices are combining to cut into demand, mortgage rates are skyrocketing. I have seen this happen before in my years with boots on the ground in real estate sales and mortgage financing decades ago. It was a lethal combination.
It should be clear by now to everybody that house price inflation has nothing to do with income growth or employment growth. House price inflation has had one driver since 1982. Falling mortgage rates. This chart shows how mortgage rates have moved in near direct proportion to one another. House prices are plotted on a log scale on the left. Mortgage rates are plotted on a log scale inverted on the right.
They have moved together for 34 years, with rates tending to lead most of the time.
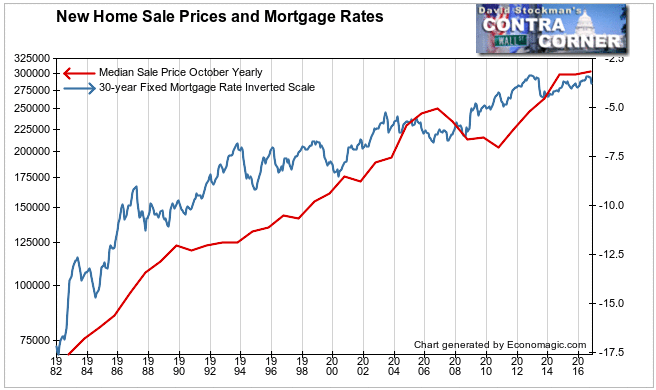
As mortgage interest declined, buyers could afford to borrow more. But this has its limits as prices have been rising faster than rates are falling. Another hard limit is that mortgage rates seem to have gone as far as they can go on the downside. They have already risen from 3.4% in August and September to around 4.13% today. They appear poised for a rise at least back to trend, which is around 5% today.
With buyer qualifying ratios maxed out there can only be three outcomes. The market could seize up and sales volume collapse. Or to prevent a sales collapse prices must fall enough to offset the rise in rates and keep the total monthly payment from rising. Finally, lenders could decide to loosen lending standards and allow more buyers to get in over their heads, spending more than they could afford.
Amy of these outcomes would be a disaster. Sales drying up would ripple through the economy. Falling prices would destroy equity and transfer risk back to the financial system as collateral values fell. And we have seen what loosening lending standards can do in the aftermath of the Great Housing Bubble 2001-2006.
As a market timer, I’m in the business of analyzing not only what to expect, but when to expect it. In the next report on this, I’ll take you through a couple of measures of personal and household income and their relationship to new home prices and sales. They suggest that the market is at its peak now and that hard times for housing and the financial markets are just ahead.
Lee Adler first reported in 2002 that Fed actions were driving US stock prices. He has tracked and reported on that relationship for his subscribers ever since. Try Lee’s groundbreaking reports on the Fed and the Monetary forces that drive market trends for 3 months risk free, with a full money back guarantee. Be in the know. Subscribe now, risk free!

