
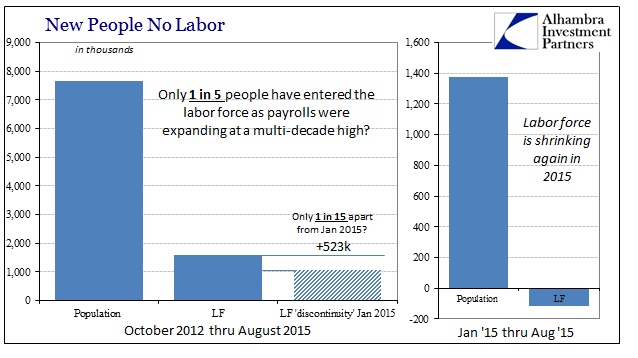
There are only two numbers in the monthly payroll report that have any meaning, and both came up quite short yet again. The first, as always, is the labor force itself as that population estimate more than any other indicates the relative station of the US economy. There has never been any time in recorded economic history where economic growth is satisfactory, let alone booming, and labor participation isn’t rising. As per usual, that continued to be the case, assuming the growing economy, in August.
The labor force was down another 41k last month and remains 115k below January. Since October 2012, the labor force has only added 1.57 million, of which 1.05 million was in January 2015 alone (a likely statistic discontinuity). That means an increase of just 523k where jobs are purported to have been solid and even highly expansionary. In the greater sense of economic advance, even the Establishment Survey’s addition of 7.7 million jobs falls short when compared to the 7.1 million increase in the civilian non-institutional population. None of these figures add up to much actual economic gain, which is the greater sense of the trajectory since the global economy slowed precipitously in 2012.
The second meaningful figure in the payroll report is just how much the Establishment Survey has itself decelerated. To my view, it is absolutely clear the upward bias in the “trend-cycle” component of the estimate which only suggests that the slowing of payroll gains in 2015 is “real” and thus highly understated to the degree at which it may be eroding. That is the view from the Household Survey, too, which more than suggests whatever the actual absolute change the direction is not in dispute.
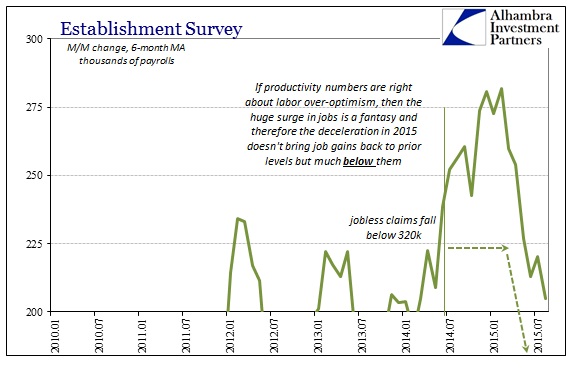
Where the 6-month average for the Establishment Survey is down to 205k (with revisions to prior months) the HH Survey shows just an average of 123k. It has become suddenly fashionable to blame seasonality (apparently economists circulated a memo amongst themselves at some point prior to today’s release making sure that everyone highlighted August’s seasonality; which is curious on its face because if August is highly seasonal to the downside than some other month[s] would be equally and in the opposite direction, but that never gets pointed out), so the 6-month averages take care of all that. At any rate, given the deficiency in the construction of the statistic, the monthly variation is so very unimportant particularly in light of the assumed overall trend.
By these two counts, the economy isn’t looking good at all though it might be said it hasn’t gotten a whole lot worse, either. Maybe in the end that is “transitory” and comforting, but as with so many manufacturing indications it might also suggest looming problems yet to hit. In other words, like inventory, if labor is only decelerating or even slightly declining and the economy snags a serious rough spot, what might that imply about the near-term ahead if “transitory” is revealed as fantasy?
In addition to that potential downside, there is the structural realization that the labor market/consumers might be facing that prospect having never recovered from the last downturn. That one major point of actual recovery is to fortify marginal gains against the next cycle; something that simply hasn’t happened here, meaning we have no true idea the actual resiliency in the face of renewed turmoil.
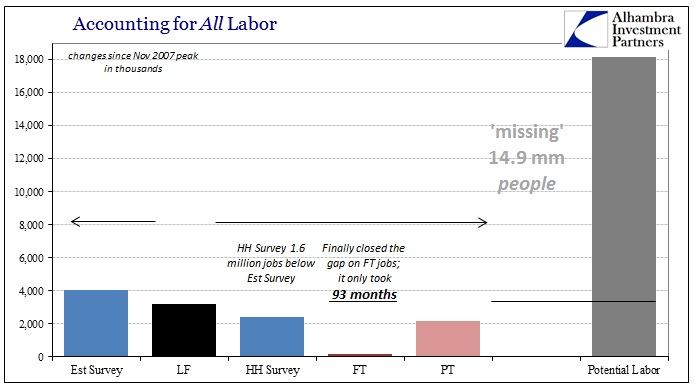
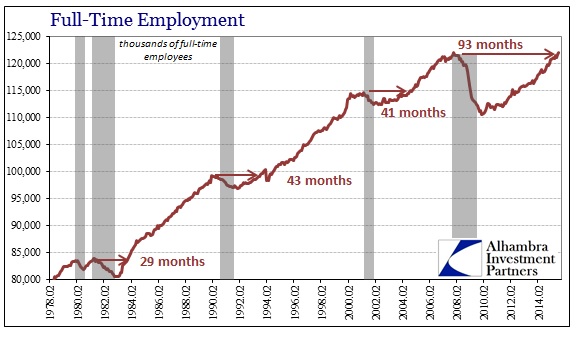
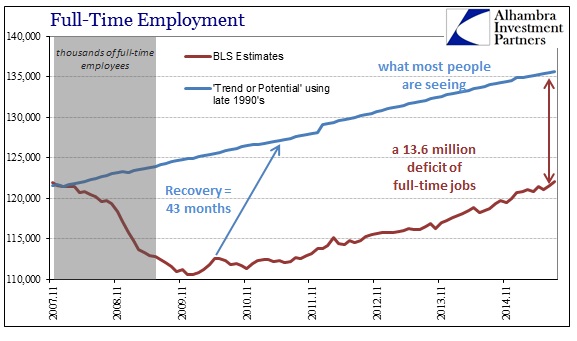
I’m surprised there hasn’t been more in the media about the fact that August 2015 finally broke to a new high in terms of full-time jobs. When the overall Establishment Survey did the same last year it was widely emphasized, even to the point of mention by Janet Yellen (maybe with all the seasonality references there just isn’t enough space?). However, this measure is by its own standing not quite open to positive interpretation even where “they” might try the most to turn it into a recovery waypoint.
It would have been a recovery had the same restoration occurred in the middle of 2011 rather than 93 months after the prior peak. Where the level of full-time jobs is now even with that departure point for the Great Recession, the civilian non-institutional population has grown by just over 18 million. With only 4 million “new jobs” on the Establishment Survey side, likely part time, (vs. just 2.4 million for the HH Survey) since the last peak, it isn’t any wonder that the labor force itself is just 3.2 million greater over those almost eight years. But where economists see retiring Baby Boomers and might even acknowledge the student loan bubble here, those “missing” nearly 15 million are an enormous economic hole already should the economy take its full downturn at some point.
It is exceedingly difficult to fathom what that might mean in terms of the potential worst case (which seems to be a habit of late now that “transitory” is, again, finding itself disproven and misplaced). I suppose, if you felt toward the optimistic side, that with labor already so devastated and shriveled how much worse could it get? And that might even be a real possibility, but I can’t help but think how this economy, here and worldwide, has the damning capacity to only disappoint, greatly, at almost every turn in almost every imaginable way. That seems to be the sole unifying theme for the “recovery”, finding new ways to reach the depths.
As for the FOMC and the federal funds rate, TDF, RRP and IOER (they can’t anymore just “raise rates”), I have no idea if the “seasonal” disappointment over the August number makes them move or not move. Given recent history, it seems their persistent unease so far in what “should” have been a much more relaxed and celebrated decision is all that is necessary to understand the general economic tone even from the most charitable perspective. Everything shown above, especially those two primary stats, simply confirms that.

