
Every now and again the apparatchiks who dutifully tend Washington’s statistical sausage factories accidently let loose a damning picture of what actually goes on inside. In that vein the BLS has just published the equivalent of a smoking gun. Namely, a study showing that in 2013—the year of 32% stock returns—the business sector of the US economy generated no more labor hours than it did way back in Bill Clinton’s blue dress period (1998) yet purportedly produced 42% more output in real terms:
“…workers in the U.S. business sector worked virtually the same number of hours in 2013 as they had in 1998—approximately 194 billion labor hours.1 What this means is that there was ultimately no growth at all in the number of hours worked over this 15-year period….. it is perhaps even more striking that American businesses still managed to produce 42 percent—or $3.5 trillion—more output in 2013 than they had in 1998, even after adjusting for inflation.
Striking indeed! The most important thing we know about those 194 billion labor hours is that the mix of labor supplied to the US economy deteriorated drastically during that 15 year period owing to the sharp decline of the goods producing economy in the US and its replacement by the low productivity HES Complex (health, education and social services).
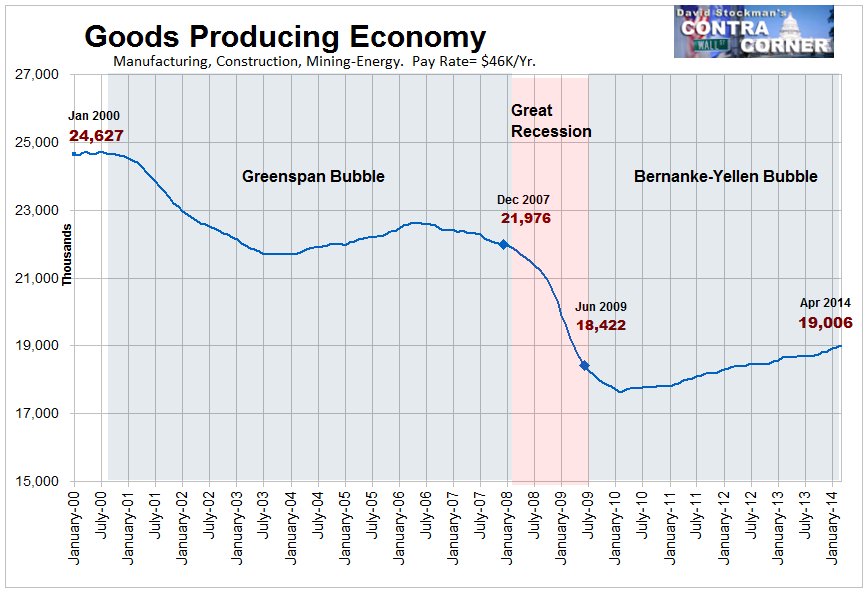
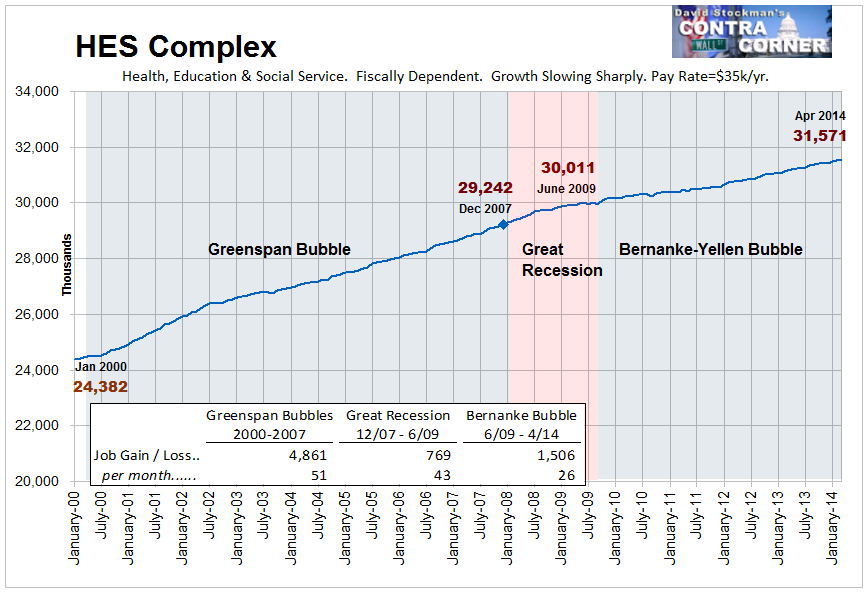
So the implication of the BLS study is that business sector productivity soared—at about 2.4% annually over the period— even as factory materials handlers were replaced by bedpan handlers in the labor mix. Needless to say, to smell a skunk in that woodpile does not take a lot of sniffing.
Here is the reason. The BLS claim that real business sector output grew by 42% during the period, and therefore that private productivity grew by leaps and bounds, is based on an arithmetical derivative, not a direct measure of output. Stated differently, what the GDP accounts measure directly is spending by households, business and government—a metric which is then “deflated” by patently low-balled guesstimates about the inflation rate. Subtract from that figure for “real GDP” actual government consumption and investment spending (plus a small amount for household sector output) and, presto, you get a fiction called “business sector output”.
According to the BEA’s official publication of the NIPA accounts, that figure was $8.4 trillion in 1998 and just shy of $12 trillion in 2013. Moreover, the BEA is not shy in explaining how it computes business sector output:
Equals gross domestic product excluding gross value added of households and institutions and of general government.
So the government statistical mills are essentially dividing an apple from the BLS (total labor hours) and an artificially modified spending orange from BEA (real GDP) to get a miracle of productivity growth since 1998. Yet common sense and self-evident social and economic trends suggest just the opposite.
In truth, the business sector of an economy which has generated no labor hour growth in a decade and one-half might well still be closer in size to $8 trillion than today’s $12 trillion guesstimate. That’s especially true when it is recalled that what passes for employment gains during the monthly ritual known as “Jobs Friday” is simply the cycling of low-productivity jobs in bars, restaurants, retail emporiums and temp agencies. Even then, the entire part-time economy has generated only 20k jobs per month on average during the last 172 months running.
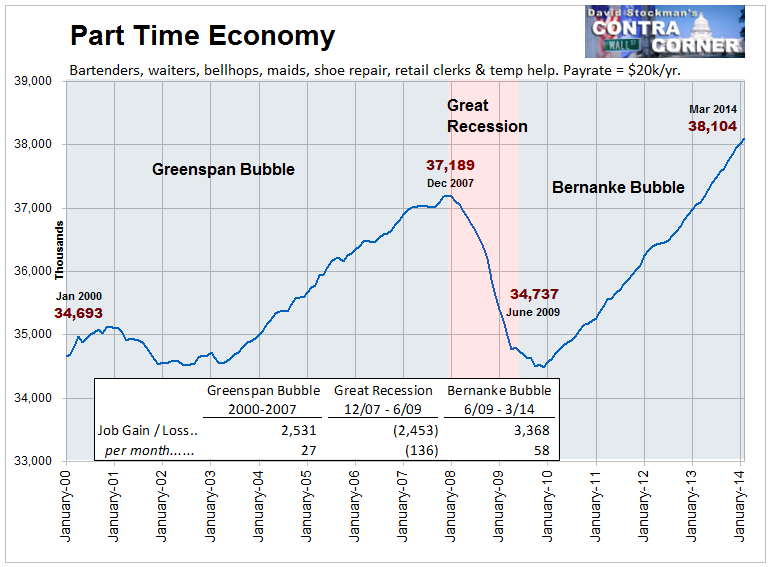
To be sure, the above data is enough to excite the boys and girls on bubblevision because despite purportedly being in the financial analysis business they are actually headline readers who bring no more insight to the table than headline sniffing algos—except that they move their lips far more slowly. Still, the vast expanse of the Part-Time Economy contains some embedded math that raises some pretty serious “Where’s Waldo” questions about that purported $3.5 trillion gain in real business output since 1998.
Today the average Part-Time Economy job (hospitality and leisure, retail, personal services and temp employment agencies) generates pay of about $20k annually, and there have been no gains in real hourly pay in this sector during the past 15 years. So when all is said and done, the Part-Time Economy has generated perhaps a $70 billion gain in the real wage bill since 1998 (3.5 million net jobs added X $20k).
Moreover, it does not take much familiarity with the income statements of bars, restaurants, hotels and mall stores to recall that the wage bill, in turn, amounts to 20-25% of total sales, and in some cases considerably more. Accordingly, the math of the thing doesn’t get you very far.
Multiplying the estimated wage bill gain by 4X you get real business output growth of around $300 billion. That is, the apparent real gain in the Part-Time Economy since 1998 amounts to just 8.5% of the purported $3.5 trillion growth in total business sector output.
That leaves a pretty enormous growth deficit to fill elsewhere, of course, but there are pretty big remaining swaths of the business economy that are definitely not candidates for the job.
Consider some of the highest productivity sectors of the manufacturing economy. As shown below, domestic auto output in 2013 had recovered from its crisis low, but was virtually flat with its 1998 level, meaning no net gain over the 15 year period. Moreover, the graph below is measured in nominal dollars which were paid at the factory gate for US produced cars and trucks. There’s no way that could contribute to the 42% real (inflation-adjusted) business sector output gain—unless the good folks in the statistical mills are playing with some heavy “hedonic” adjustments which turn a flat trend into a rising one by bureaucratic writ.
![]()
The highest productivity industry in American—computers and related products—can’t fill the gap, either. As shown below, nominal shipments have fallen by 75% since 1998. Were the government stat boys measuring business sector output directly, they would undoubtedly apply a whole heap of hedonics on this chart to turm a line which is plunging southward into a curve which is ascending in a firm northerly direction. But that hocus pocus occurs in the spending accounts, not here. What this graph explains is something far more logical. Aggregate labor hours have not grown since 1998 because in many important sectors of the US industrial economy, employment and shipments have been chronically shrinking.
![]()
Likewise, the missing gains cannot possibly be found in many of the other manufacturing industries which have essentially been off-shored since the mid-1990. Here are three examples where nominal output is essentially flat; where labor hours have been steadily falling; and where it would take more hedonics magic to turn the trend into real gains.
![]()
![]()
![]()
Another non-candidate for the missing $3.5 trillion of business sector output is the construction industry. Yet once again, the tepid recovery we have had to date from the 2009 bottom does not get new housing construction—the largest component of the overall construction industry back close to its 1998 level. So Waldo is not lurking there, either.
![]()
In truth, Waldo is actually to be found in the place where Keynesian economists live—that is, in the spending accounts, and the deflators which are applied to them. As will be shown in Part 2, there is absolutely no reason to believe that the 2.0% GDP deflator for 1998-2013 captures the actual inflation experienced by the American economy during that 15 year period.
Accordingly, there is every reason to believe that real GDP growth has been considerably lower than reported. That is, it has been more consistent with a stagnant economy that generated zero labor hour growth in the business sector; a pick-up in food stamps and disability dependency from 23 million to 60 million over the 15 year period; and which saw real household income fall from $57k to $52K or by 8%.
Stated different, the truth about the Fed’s dangerously misguided ZIRP policy is that it generates a ZIRP economy.

