
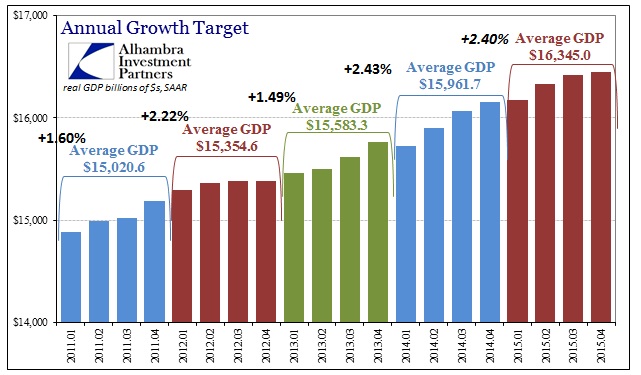
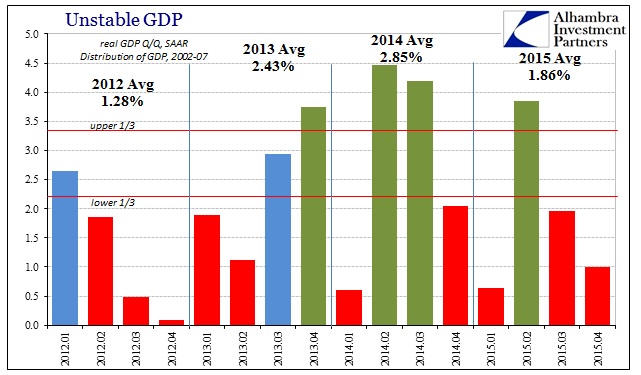
The advance estimate for Q4 GDP was not appreciably different than the preliminary figures, changing +0.6% into +1.00033%. It wasn’t anywhere close to enough of a revision to meaningfully alter the picture of the 2015 economy. The average growth in 2015 was just 2.40% (until the next revision next month) compared to 2.43% in 2014; while the average of SAAR continuously compounded rates was hugely disappointing at only 1.86%.
Economists also use an additional calculation for yearly growth, comparing any year’s Q4 estimate with the prior year’s Q4. On that basis, the US economy also seriously underperformed with the latest upward revision being inconsequential.
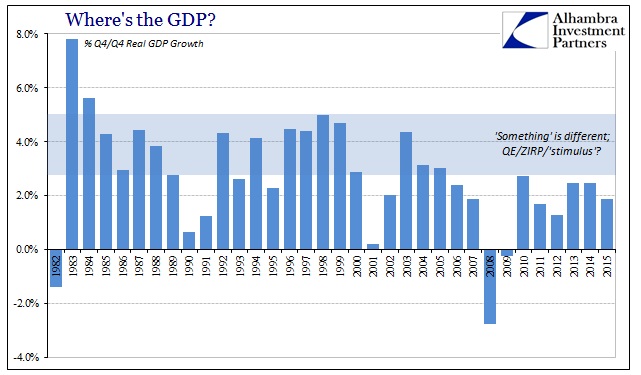
GDP growth via this standard was as bad in 2015 as in 2011 or 2012. It has been rare (recession rare) to find growth below 2% in any yearly comparison, yet three have appeared in this one “cycle” alone. Having encompassed six years now, it offers still more compelling evidence that there was a paradigm alteration during the Great Recession; or, more specifically, the Great Recession revealed the extent of prior economic damage done.
In terms of cyclicality, GDP is largely unhelpful in determining any inflections as it is, but in this current environment I suspect that post hoc revisions will make it even more difficult to find here. In other words, as deficient as 2015 was in GDP, it’s not at all clear that we have any idea to what actual degree. Take the case of 2012 which held a very significant number of parallels in estimates and the behavior of economic accounts which remained outside of GDP for several years (the initial runs for GDP showed only one significantly weak quarter, Q4 2012). It wasn’t until the Census Bureau’s bi-decadal Enterprise Census that GDP was scaled back to better match contemporary indications showing at the time much more severe weakness. As I wrote last summer:
The 2012 slowdown, now finding its way to GDP, shows the same permanent alteration in trajectory as so many other non-adjusted economic accounts. That has great implications for our current circumstances, not least of which is how GDP in 2014 (and likely 2015) might be similarly overstating the post-slowdown economy. If retail sales, capital goods orders, import activity (China’s economy, Brazil, etc., etc.) all found the slowdown years before GDP, then it is reasonable to assume similar circumstances where the same divergence shows up again; i.e., right now. That is especially true when these other accounts are considerably worse now than they were in 2012 and early 2013.
The basis for those revisions (updated in July last year) was consumer spending that prior benchmark guesses (trend-cycle) were sure was happening but never did. In other words, the statistics were modeled such that consumers were behaving closer to how they had in past recoveries; only to admit years later that the mountain of evidence and anecdotes disagreeing was, in fact, correct.
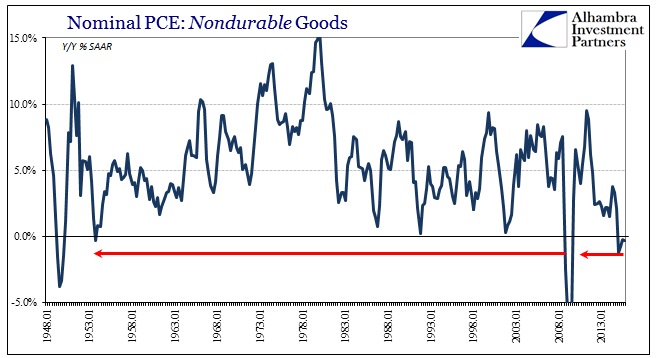
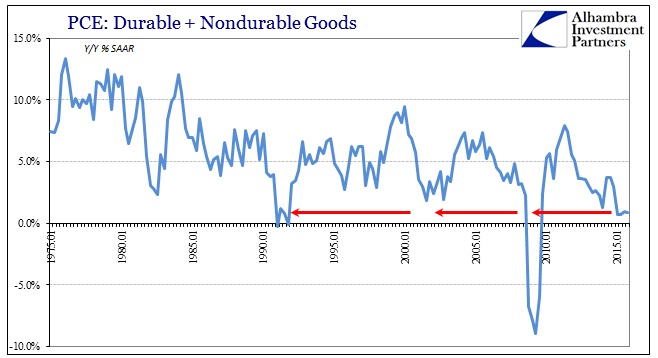
The case for 2015 in the same category as 2012 will likely be determined along the same lines. One constant has been consumer spending weakness throughout last year, even though all the fuss about oil prices as some kind of “tax cut.” The GDP figures themselves show no such thing, as spending on non-durable goods declined but were never offset by additional spending in either other forms of non-durables or durable goods. In fact, durable goods spending decelerated throughout last year, too, leaving the combined category of overall goods very much confirming why there might be a “manufacturing recession.”
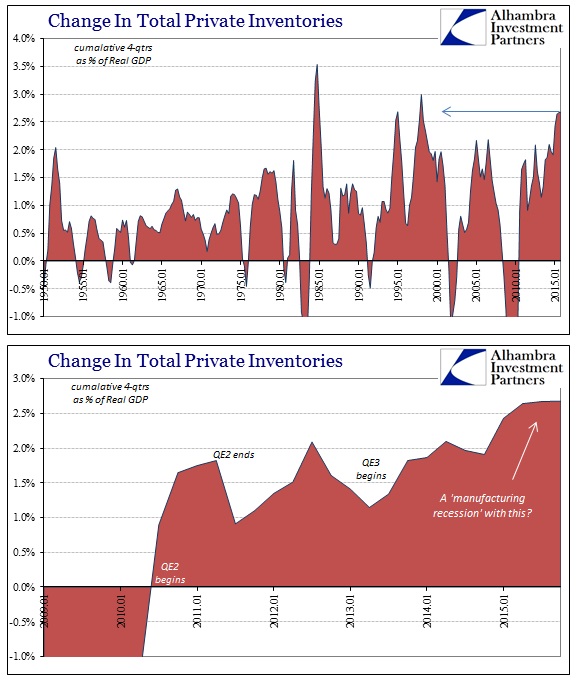
That leaves just services spending and inventory to round out GDP as merely deficient rather than fully recessionary as the goods estimates suggest. In fact, the upward revisions to Q4 were primarily due to shifting activity out of consumer spending and back into inventory again. The pace of inventory is thus continued as extreme, even though it has cooled only somewhat in the second half of last year. In that narrow view, at least GDP accounts agree with other economic estimates where the manufacturing recession has already arisen on weak consumer spending alone without yet the weight of the inventory adjustment – which remains still enormous and broad despite significant contraction in the whole supply chain already.
Beside the effect of services spending imputations (the largest single component of PCE Services is completely fabricated and does not actually exist: owner’s equivalent rent), lower inflation calculations “aided” GDP from making a worse comparison. Nominal GDP growth, Q4/Q4, in 2015 was just 3.07%. Less than 4% is actually quite rare and in fact is usually associated with, as you can guess, recession or near recession circumstances. NGDP in 2001 was 2.2%, for example, while in 2007 was 4.4%; in 1990, it was 4.5% and even 3.8% in the severe contraction of 1982.
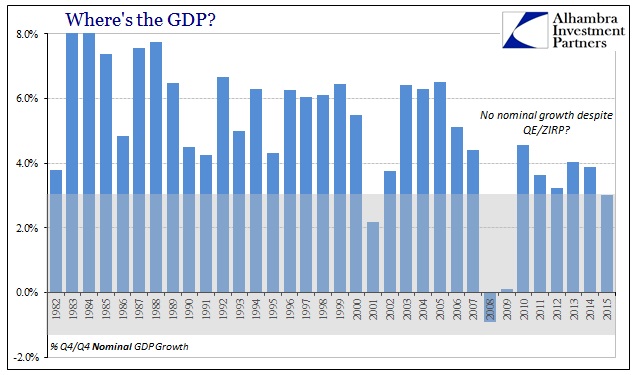
Therefore where there was a smaller deceleration in calculated real GDP, the difference in nominal terms was much larger and more significant (especially since NGDP in 2014 wasn’t especially robust either).
The price index for gross domestic purchases increased 0.4 percent in 2015, compared with an increase of 1.5 percent in 2014.
Current-dollar GDP increased 3.4 percent, or $594.8 billion, in 2015 to a level of $17,942.9 billion, compared with an increase of 4.1 percent, or $684.9 billion, in 2014.
That difference of about $100 billion is activity that consumers were supposed to undertake due to all the oil and gasoline “tax cuts” they received particularly in the beginning of the year – which would have led to increased activity overall throughout the rest of the calendar leaving the oil crash “transitory.” That none of that happened, and goods spending remains recessionary even in the current estimates (before coming benchmark revisions), suggests “something” wrong in the economy more so than the usual longer term structural problems associated with the shrunken system.
This updated version of GDP accounts, then, changes nothing about what was already suspected: consumers are in a huge hole, that is why they did not respond to oil prices unless you think services spending estimates are real and accurate (which would only raise the issue why aren’t services firms then increasing their activities to offset the huge declines in goods); inventory growth was massive, at historical extremes; and that the best case scenario for the economy is one that remains highly unstable, which isn’t much of an offsetting position given that nominal growth is falling along with consumers rather than suggesting a turnaround.

