
According to the Organization of Economic Cooperation and Development (OECD), “social expenditures” are expenditures that occur with the purpose of redistributing resources from one group to another, in order to benefit a lower-income or presumably disadvantaged population.
Social Security in the US is one example, and would be considered a “public expenditure” because it involves direct spending by a government agency.
However, governmental bodies in the US and elsewhere also employ a wide array of mandates and tax-based benefits and incentives to carry out social policy. This distinguishes the US in particular from most European countries that rely more on cash benefits or non-cash benefits administered directly by governments.
But governments are not limited to direct benefits. Governments may also employ “tax breaks for social purposes” (TBSPs) including tax credits for child care, and tax breaks for health-care related spending.
Furthermore, in the United States — more so than in other countries — governments create tax incentives and mandates that lead to high levels of “private social expenditure.” The OECD defines these private expenditures as expenditures that are designed to redistribute wealth, but are not administered directly by government agencies:
Mandatory private social expenditure: social support stipulated by legislation but operated through the private sector , e. g. direct sickness payments by employers to their absent employees as legislated by public authorities, or benefits accruing from mandatory contributions to private insurance funds.
Voluntary private social expenditure: benefits accruing from privately operated programmes that involve the redistribution of resources across households and include benefits provided by NGOs, and benefit accruing from tax advantaged individual plans and collective (often employment – related ) support arrangements , such as for example, pensions, childcare support, and, in the US, employment – related health plans
The focus on direct government spending, however, creates the impression that the US does not engage in the business of redistributing wealth to the degree of other OECD-type countries. But this is not the case. When we consider tax incentives, benefits, and mandates, the picture is very different.
When just measuring direct government spending as a percentage of GDP, the US ranks fairly low. Note however, that even in this case, the US ranks above both Australia and Canada, two countries that are rarely accused of being excessively capitalist (y axis=percentage of GDP):

Direct social spending by government constitutes 18.6 percent of GDP in the US. In Australia, the total is 16.9 percent, and in Canada, it is 16.3 percent. France tops the list with 29.4 percent.
But this just captures spending by government entities. When we look at other types of spending that result from tax incentives and mandates, things look different.
Once tax breaks for social purposes (TBSPs) are included, the US begins to look much more similar to its European counterparts. By this measure, the US falls in the middle, with more net social spending (as a percentage of GDP) than New Zealand, Norway, Luxembourg, Australia, and Canada (y axis=percentage of GDP):

By this measure, social spending constitutes 20.1 percent in the US, compared to 17.4 percent in Australia and 15.3 percent in Canada. Luxembourg is 18.0 percent and Norway is 18.1 percent. France, again, tops the list with 27.9 percent.
These tax breaks have the effect of encouraging “private” social expenditures as well, including health care spending (for example).
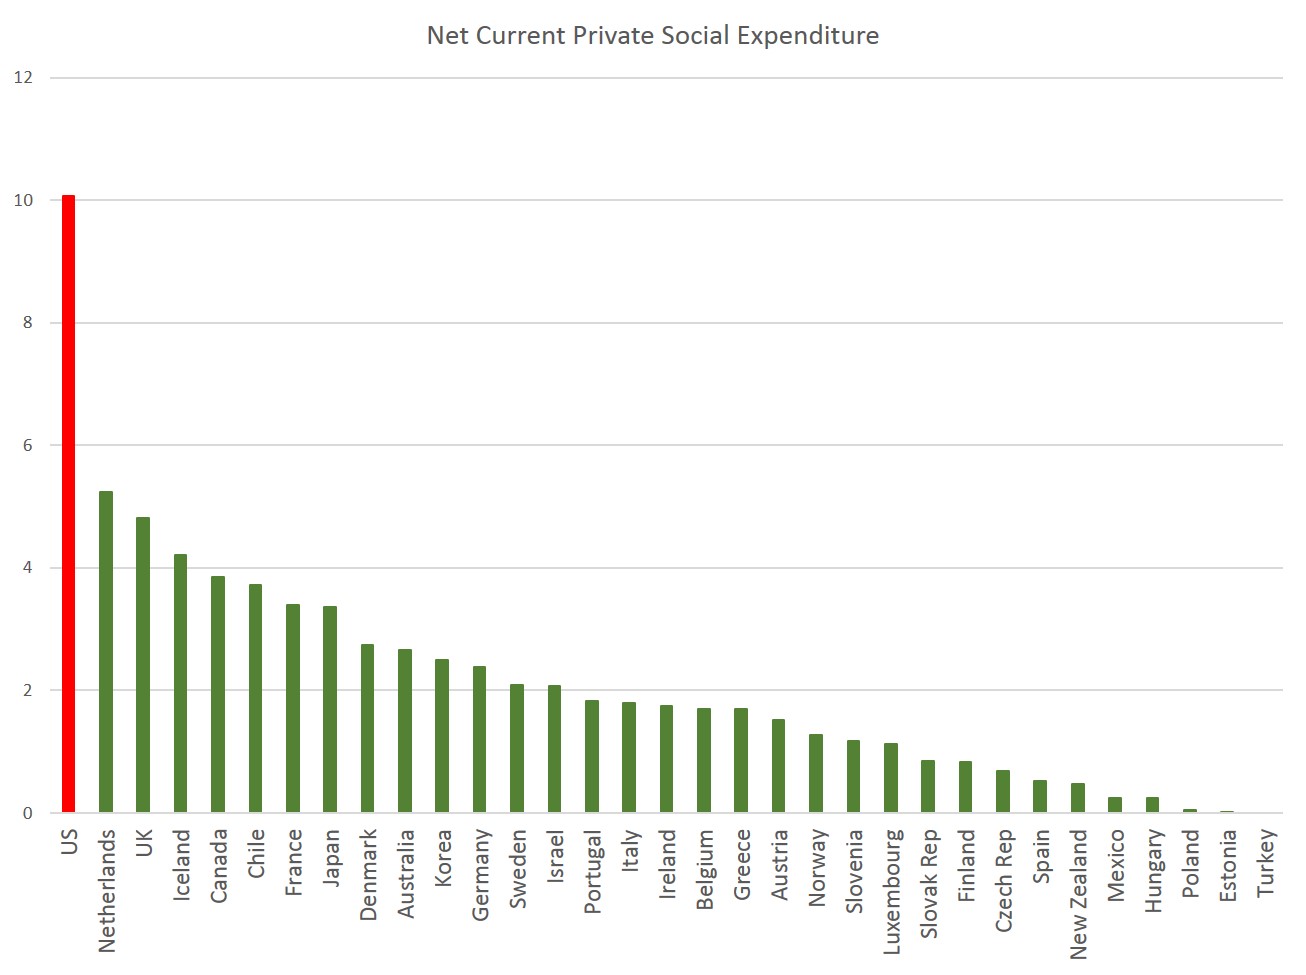
Once these “private” sources of social spending are included, we find that the US spends the most by far. We should note also that these figures, from 2011, predate the enactment of “Obamacare,” and do not reflect what will likely entail far greater amounts of private social social expenditure on health care.
In this measure, private social spending comes in at 10.1 percent which is almost twice as much as the next big private spender, the Netherlands, at 5.2 percent. The United Kingdom comes in third at 4.8 percent (y axis=percentage of GDP):
So, once we take this into account, we get what the OECD calls “net total social expenditure.” It is, of course, deceptive to ignore social expenditures that take a form other than cash transfers and transactions with government agencies. After all, numerous countries other than the US employ legislation (including tax law) to incentivize or mandate social spending with the specific purpose of providing benefits or advantages to certain households.
The resulting analysis looks like this (y axis=percentage of GDP):

In the US, net total social expenditures amount to 28.7 percent of GDP. Only France shows a higher rate than this with 31.2 percent. Belgium comes in third at 27.4 percent.
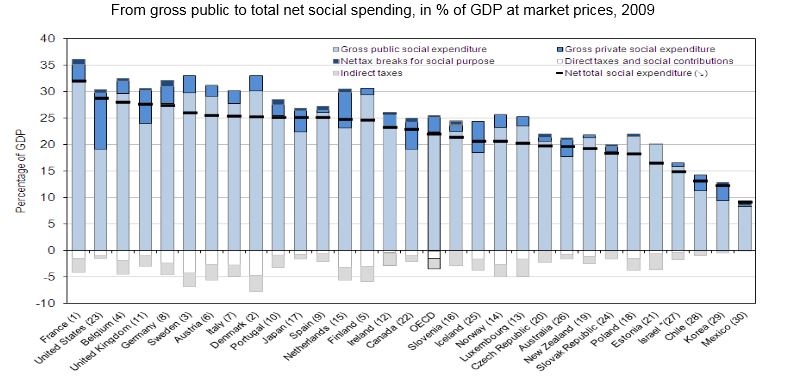
The OECD also created a nice graph that compares the “government expenditure” measure with the broader total social expenditure measure:
Conclusions
There are a few things we can learn from this analysis. First of all, it is important to note that the US does not redistribute resources any less than other countries. Like most other “developed” countries, the US employs a wide variety of public policies to benefit certain groups and income levels.
Additionally, when taken together, the expenditures that result from these public policies are sizable, and even exceed nearly all other countries measured.
Left-wing pundits and scholars who wish to portray the US as a kind of hyper-capitalist social-Darwinist system conveniently focus on direct cash transfers and social spending by government agencies while ignoring other sources of social expenditures. At the same time, conservatives and right wing pundits, for different reasons, often attempt to portray the US government as a regime that engages in less redistribution of wealth than other states. Both groups are mistaken.
Whether or not the policies employed in the US have had the effect preferred by advocates of more social spending is a separate matter from the amount spent overall. We cannot honestly say that the US is some sort of outlier when the US clearly engages in social expenditures in proportions that rival multiple states in Western and Northern Europe.
Nor should we ignore the fact that the the redistributive policies employed by the US lead to just as many distortions to the economy as does the direct social spending favored by European governments. Tax breaks for homeowners, for example, create incentives for buying homes which distorts real estate markets while increasing the relative tax burden on renters. Tax incentives that encourage more spending on health care drive up health care prices. And so on. And of course, the US employs a wide variety of direct spending and subsidy schemes that create distortions of their own, including Social Security, Medicaid, “Section 8,” and others.
Ultimately, we are forced to conclude that redistributive social spending in the US is indeed different from many other countries. But the overall magnitude is actually greater (both proportionally and in absolute terms) in the US than in almost all other countries measured. One can argue that the way that the wealth is redistributed through public policy in the US is “wrong” or “suboptimal.” But, to argue that there is less redistribution as a result of public policy in the US than elsewhere is simply wrong.
Note: The source for all above graphs is the Social Expenditure Database from the Organization of Economic Cooperation and Development (OECD). The data used refers to the year 2011. For additional analysis, see “Social spending during the crisis,” published by the OECD. Switzerland was not included in source data due to a lack of updated information.
https://mises.org/blog/social-expenditures-us-are-higher-all-other-oecd-countries-except-france

