
According to the latest GDP revisions I may have been off in my projection of where the recession began. I wrote in 2013 that if pressed I would name October 2012 as the start of the recession. There were many reasons for that assessment; retail sales suddenly and sharply slowing, durable goods and particularly capital goods orders contracting and a quite noticeable “bend” in the payroll estimates- the Establishment Survey was, of course, still mostly a straight line but the Household Survey nearly halted. Both subject to trend-cycle which meant that in any true revisions they would show up as much worse.
Further back, in 2012, I reasoned that it was these figures that had essentially scared the Fed into heavily renewing first in MBS through QE3 and then UST’s for QE4. If it was clear enough for even the FOMC to act, it was likely worse than even the numbers were showing. In November 2013, with the 2012 slowdown in full view by then, I wrote:
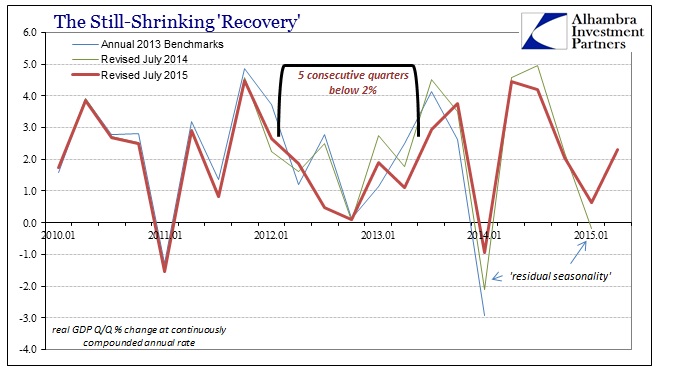
The divergence now, spanning more than a full year, is too great to simply ignore as random noise. It is significant in both the statistical meaning and for truly objective analysis. What the Household Survey shows is that there has been no job growth since last October, while the Establishment Survey demonstrates relatively weak job growth. The labor participation numbers echo the former far more than the latter, as does so many other economic accounts. The economy is not moving in 2013, which is the same as not growing (shrinking comes after revisions).
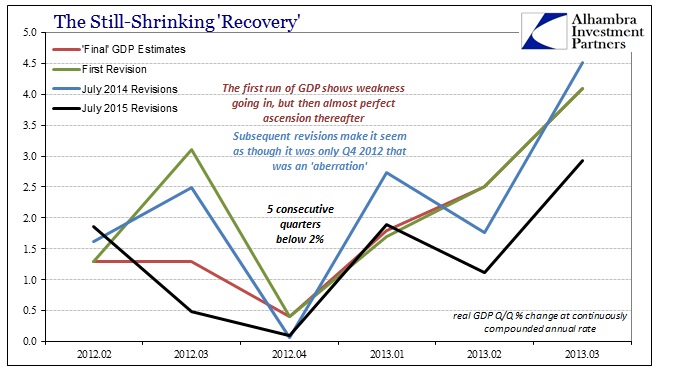
Against that view stood GDP. The initial run of estimates had produced what looked like a “pause” in growth, but one limited to just one, maybe two quarters. Anchored on only that quarter in question, Q4 2012, first GDP estimates projected Q4 at +0.4% but then an unmistakable rebound the rest of 2013. Subsequent annual benchmark revisions shrunk that “pause” to one quarter alone. The last, from July 2014, makes that plain; Q3 2012 was thought +2.5%, Q4, the “anomaly”, at only +0.1% and then Q1 2013 right back to the usual, deficient but somehow comforting by relativism 2.7%. Despite a host of evidence that there was something far more going on, GDP (and the Establishment Survey) was contrarily so reassuring as the mainstream economic arbiter.
The main difference between the July 2014 revisions and the July 2015 update is the incorporation of the bi-decadal Economic Census. I have referred to this on several occasions as it produced quite significant downward adjustments in retail sales and durable goods. What the Census found was that retail activity, in particular, as main proxy for the consumer just wasn’t there as they thought would be, attributable to over-optimism (trend-cycle) about how the economy would function in what was believed at least a resembling recovery cycle.
That meant the GDP updates for the July 2015 benchmarks aren’t really a surprise except to mainstream commentary and economists that couldn’t see the significance of the 2012 slowdown. Going by GDP alone, it sure looked like no big deal, just a one-quarter aberration that could easily be cast aside (except that these aberrations seemed to be repeating, but that is another problem). With the full(er) incorporation of the broader Census data, what was only one-quarter is now projected as a full five-quarter detour – it took almost three years but the 2012 slowdown has finally arrived in GDP.
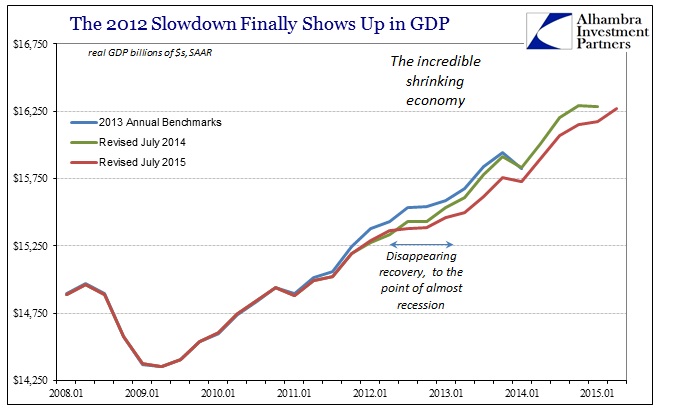
The downward trajectory is significant in its own right through just compounding, as lower growth leads to, yet again, a smaller economy than what was thought. In terms of growth rates, the difference is more so accumulation than just the raw numbers. In other words, the first revised figures (the estimates for a particular quarter that come immediately after the “final”, released with the “advanced” estimate for the following quarter) average 1.80% in growth for those five quarters; the 2014 revisions show an average of 1.73%. The new updates including the 2012 Economic Census are for an average of just 1.09%; more than a year of GDP growth at about 1%, which is how far from a mild recession? The average growth of the four quarters in 2001, encompassing all of the dot-com recession, was a similarly lumpy +0.2%.
When looking at just the slowdown revisions in isolation, the misleading nature of GDP is easily revealed:
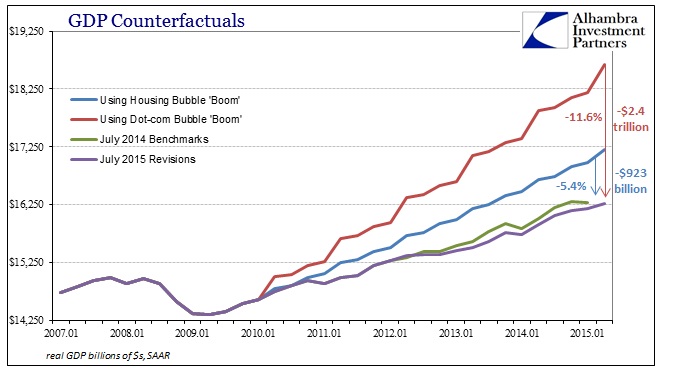
The significance of this belated-admission is far greater than any semantics about recession or cycle. The 2012 slowdown, now finding its way to GDP, shows the same permanent alteration in trajectory as so many other non-adjusted economic accounts. That has great implications for our current circumstances, not least of which is how GDP in 2014 (and likely 2015) might be similarly overstating the post-slowdown economy. If retail sales, capital goods orders, import activity (China’s economy, Brazil, etc., etc.) all found the slowdown years before GDP, then it is reasonable to assume similar circumstances where the same divergence shows up again; i.e., right now. That is especially true when these other accounts are considerably worse now than they were in 2012 and early 2013.
In this new context, however, the generalized weakness is not surprising nor would it be taken as anomalous. The slowdown in 2012 set the trajectory for the elongated cycle, which is why I still think the recession started somewhere back then – but it doesn’t conform to all prior thought about how recession and contraction function. We know that the recovery portion itself has almost totally deviated from historical precedence, so it isn’t too far of a leap to assume that might be true on the other side of the cycle. That is especially possible when this elongation shows up in at least partial effects in front of both the Great Recession and dot-com recession – all these “cycles” encompassed within the serial asset bubble/high monetarism period.
Interpretations about economic performance thereafter should be contained within that paradigm; and so continued instability and weakness, even to the point of outright and sustained contraction, wouldn’t be at all “unexpected” it would, in fact, be the logical and inevitable destination. For my own part, these GDP revisions show that I may have been wrong in dating the change in cycle; not October 2012 but perhaps one quarter earlier.
For now even GDP to belatedly show the 2012 slowdown that was obvious everywhere else should end the recovery debate entirely, especially in the wake of all those same economic accounts falling apart once again and to a degree not seen since 2009. Instability in the economy, however picked up by the various accounts, is symptomatic of this reconfirmed “cycle” archetype.

