As doubts surrounding QE have grown, there has been a somewhat detectable if still small trend in central banker repentance. Alan Greenspan to an extent has embraced a more decentralized and market framework in his public comments even though he has yet, to my knowledge, actually repudiate his own work more directly. As noted a few days ago, former BoE governor Mervyn King has been far more open and alarming. While that may seem to indicate that monetarists only find free market “religion” once out of the drudgery of their professional office, I think Zhou Xiaochuan, head of the PBOC, performs the exception.
The direction the Chinese central bank has taken since late 2013 seems to confirm that idea more and more. Viewed as a repudiation of textbook monetary tactics and even basic justifications, the PBOC has become if not more “market” oriented at least drastically shifting priorities from the conventional, QE definitions of “growth at all costs” to something like managing that past mistake (as the PBOC took orthodox monetarism to new levels of insanity from 2009 through 2012). Last April, really at the outset of what China was about to do, Zhou issued a warning that looks to have been quite appropriate:
“If the central bank is not a part of the government, it is not efficient in coordinating policies to push forward reforms,” [Zhou] said.
“Our choice has its own rational reasons behind it. But this choice also has its costs. For example, whether we can efficiently cope with asset bubbles and inflation is questionable.”
That certainly seems to be a damning repudiation of the monetary illusion. Faith in the QE world is waning everywhere and with very good reason; it just doesn’t work in anything outside of dangerous financial imbalance and asset price inflation. Even Krugman appears to have wavered:
“I’m still really, really worried,” Krugman said at a conference in Tokyo on Wednesday. A big problem remains building enough momentum in the economy to escape deflation, he said.
Krugman said he is concerned that Abenomics is getting bogged down as the Bank of Japan fails to spur inflation to a 2 percent target, hampered by falling oil prices. The economy is struggling to rebound after a contraction last quarter, while the central bank’s main gauge of inflation fell to zero for a third time this year in July.
One former central banker and academic economist (redundant) who is not contrite in the slightest degree is Ben Bernanke. Bernanke has been writing consistently about how he not only believes QE’s work, they did work (to some qualified extend) and further that there aren’t any bubbles – not even a stock bubble. In dealing with the leftward sting of “income inequality”, the former Fed chair wrote on June 1:
Stock prices have risen rapidly over the past six years or so, but they were also severely depressed during and just after the financial crisis. Arguably, the Fed’s actions have not led to permanent increases in stock prices, but instead have returned them to trend. To illustrate: From the end of the 2001 recession (2001:q4) through the pre-crisis business cycle peak (2007:q4), the S&P500 stock price index grew by about 1.2 percent a quarter. If the index had grown at that same rate from the fourth quarter of 2007 on, it would have averaged about 2123 in the first quarter of this year; its actual value was 2063, a little below that. There are of course many ways to calculate the “normal” level of stock prices, but most would lead to a similar conclusion.
From this view, the Fed acted quite appropriately with regard to stock prices in order to get them back to their own established trend; therefore no bubble. It isn’t surprising that his math works out, as you can plot his figures on a chart of the S&P 500 and see his reasoning painted forth.
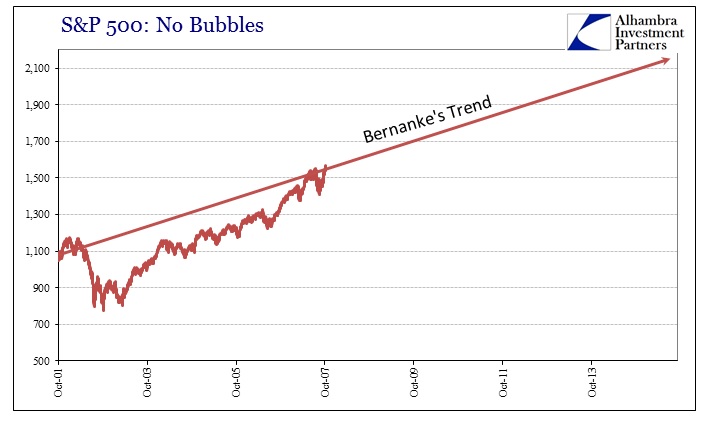
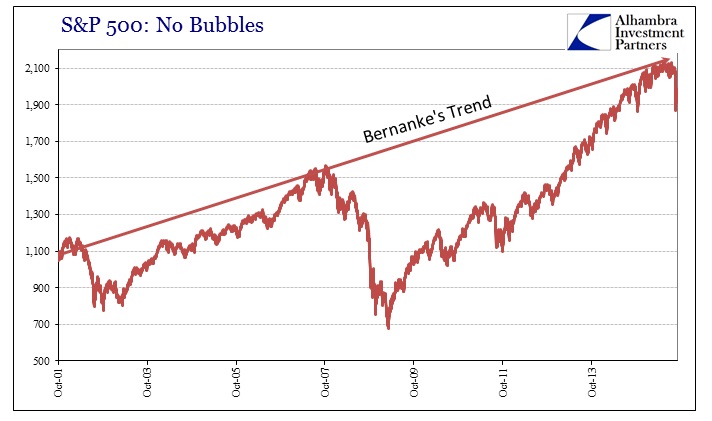
Starting at the end of the dot-com recession sometime in the last quarter of 2001, a 1.2% per quarter trend nicks the top of the market in 2007. Ignoring the implications of panic and crash through March 2009, as he does, filling out the rest of the chart puts the current (before August 24) stock index directly within the path of his trend.
It is a ridiculously weak argument for obvious reasons, not at all unlike his defense of QE in the real economy via the unemployment rate without mentioning the denominator. It isn’t clarified in his post, but it seems equally evident that he picked the end of the dot-com recession as a start date because that is when Greenspan’s Fed brought forth “ultra-low” interest rates (see below). So if you believe that “ultra-low” interest rates are responsible for the current stock bubble, there you go.
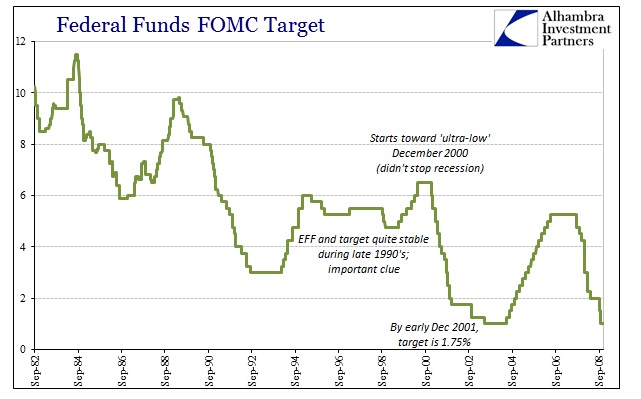
Of course there is already something missing from this intentionally narrow review, namely that the dot-com bubble had already occurred; it was that process that seems to have led to “permanent increases in stock prices”, but only intermittently. Thus ultra-low interest rates were not at all its source but rather the FOMC’s belated attempt to minimize the damage from the inevitable. Many people have instead extrapolated interest rates into just the housing bubble (which that was certainly a factor, but clearly not the true bubble source) but without explanation for the dot-coms. Bernanke is trying to be clever here by using that vagueness on the first part to his advantage.
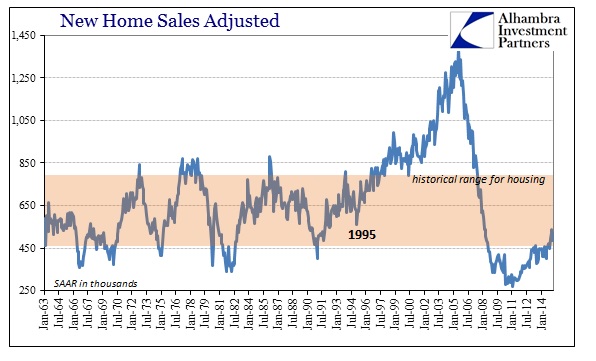
In fact, the housing bubble did not begin in 2003 when Greenspan got the FOMC down to 1% on the EFF, it had already been under way for nearly a decade by then. His efforts, such that there might have been any effect, was only to partially aid unleashing the true mania (though I would argue that even here the federal funds rate is given an overstated role as I have little doubt the housing bubble was going where it was going no matter what Greenspan did or did not do; the evidence for that is how rising interest rates in 2004 had so very little impact, as dark leverage in especially CDS just exploded at that very moment). Put together, the stock bubble (or repeated stock bubble) dates to around the same time as the housing bubble, which should not in any way be unexpected.
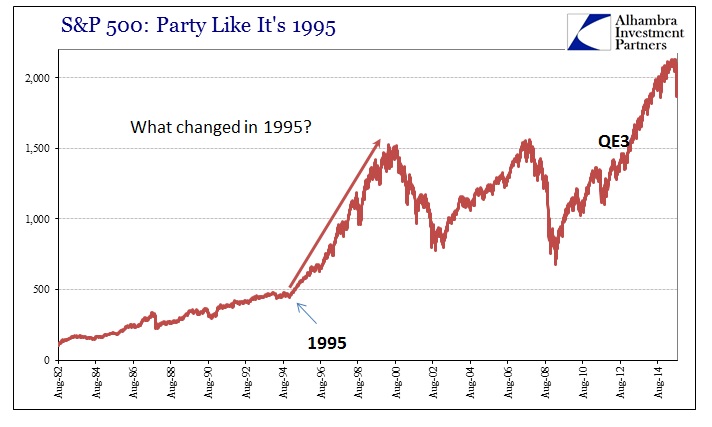
We don’t even have to search very hard for the commonality of 1995, either. It was at that time, developed throughout the late 1980’s and early 1990’s, the JP Morgan “sold” its RiskMetrics platform widely to Wall Street and London. The torrent of dark leverage and wholesale “banking” that would be unleashed through the mathematical effects on balance sheet leverage, extended and received, was simply obvious. That counted, too, for the global effects upon the eurodollar stage, as the surge of the “dollar” coincided with the end stage of pure economic financialization. Greenspan believed, as did almost everyone else, he was controlling the economy through minute fine-tuning of the federal funds rate, a quarter point here, quarter point there, as if those made any true difference. Instead, the “dollar” was surging everywhere but especially Europe (this is Bernanke/Greenspan’s mysterious “global savings glut”; not “savings” at all but balance sheet expansion across multiple dimensions).
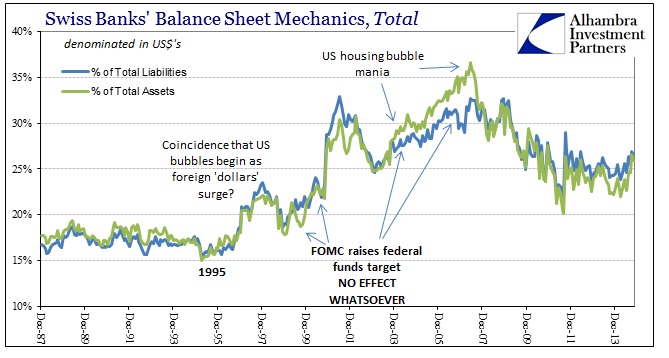
If the eurodollar takeover was instead responsible for the serial asset bubbles of the past two decades, then it would make far more sense to extrapolate stock trends from that point rather than the irrelevant and overstated federal funds monkeying. So where Bernanke’s stock trend aligns the peaks as if that were “fair” and of the real market, the troughs instead just as easily conform traced back to the plainly obvious eurodollar deviation.
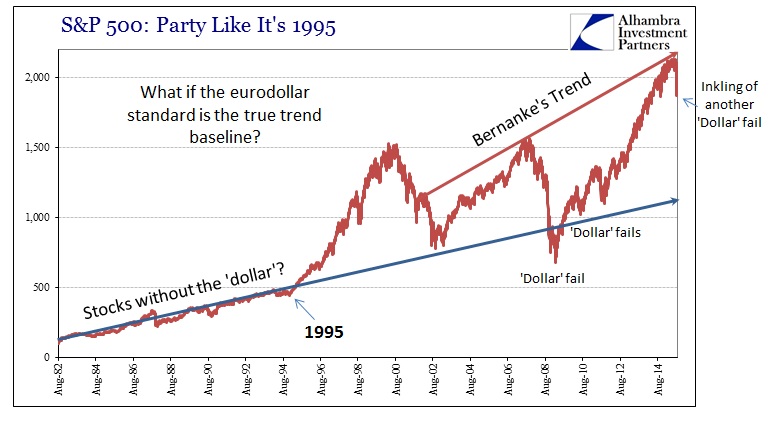
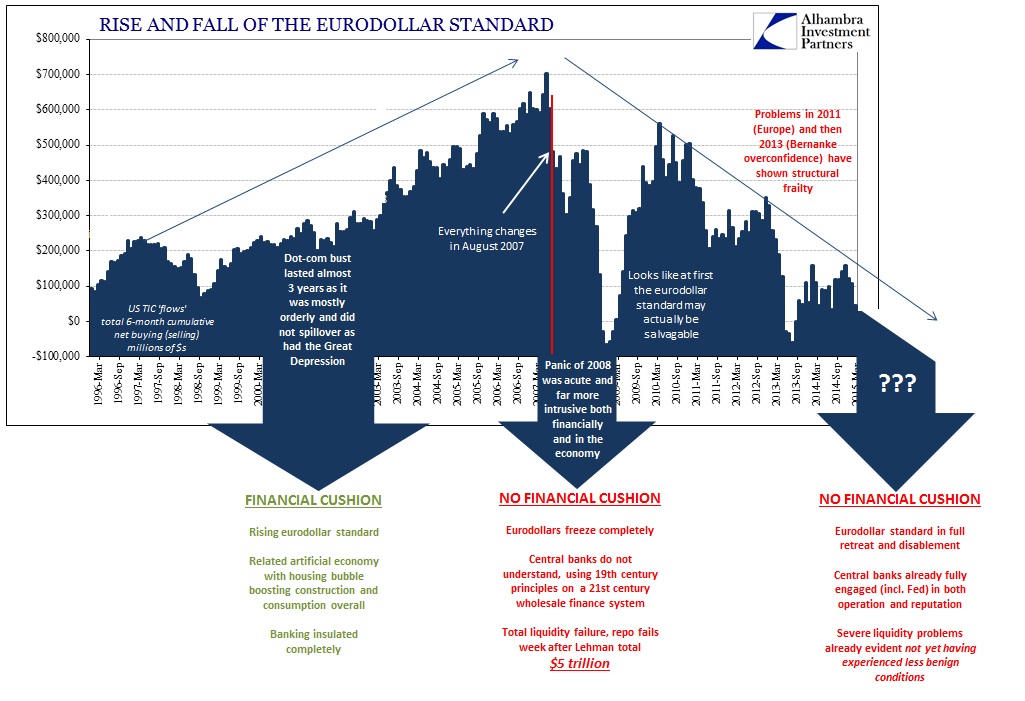
In this context, the panic in 2008 makes perfect sense as it was a total failure of the eurodollar/wholesale system which not only reversed in total the prior bubble levels it crushed the global economy with it. The failure of the eurodollar standard to heal or rebuild to its prior upswing (ended on August 9, 2007) was seen more so in the real economy (the 2012 slowdown) but also in the stock market in 2010 and again in 2011; both those outbreaks appeared to revert back to that “dollar baseline.”
The fact that asset inflation can continue on its own apart from any financial contribution of the wholesale “dollar” is due to partially separate liquidity and funding sources. Liquidity isn’t everything always, but when it is failing it takes over for the dominant marginal direction. In other words, corporate repurchases and retail flows might be sufficient for stock prices to rise and rise rapidly where the “dollar” isn’t as supportive, but those are easily overwhelmed where the “dollar” is acutely retreating (as August 24).
When we plot Bernanke’s 1.2% per quarter benchmark at a start date of January 1995, that compounding growth works out to a “target” S&P 500 level of 1236.09 for Q3 2015.
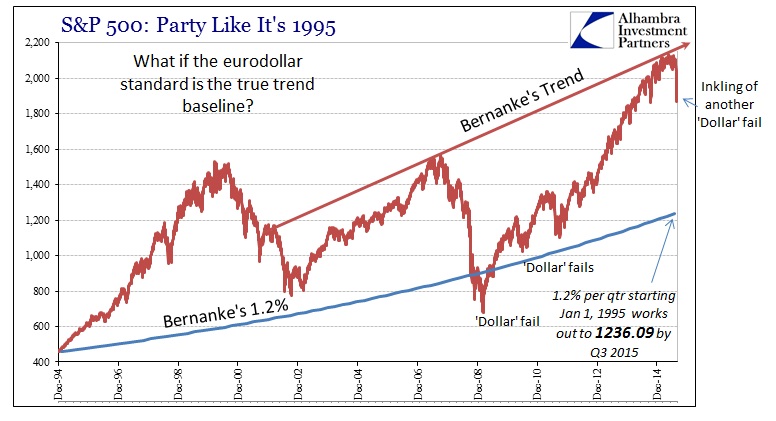
Where his 1.2% per quarter within the bubble mechanics calculates to 2123 (as of June) for the S&P 500, applying the same idea to starting outside the serial bubbles is vastly different (-42%).
I’m not making any claims about whether 1236.09 is “fair value” for the S&P 500, only realizing the true nature of the stock bubble makes a huge difference. He isn’t quite taking the full weight of the Yellen Doctrine here (I define that as her notion that a bubble isn’t really a bubble unless it doesn’t “work” in the real economy) but you can see how he is, by the construction of his trend narrative, thinking in at least that direction. Both are attempts to justify asset inflation by moving the perspective to within the bubble period so as not to have to explain how it all arrived in the first place (inferring from Bernanke’s intent: since the dot-com bubble predates “ultra-low” interest rates it can’t possibly be the Fed’s fault, and therefore the Fed has been successful in simply re-establishing what the “market” did on its own beforehand).
I think that is true but only in the narrow view that interest rate targeting didn’t actually do much of anything – which was and remains the whole problem. If interest rate targeting didn’t directly cause the asset bubbles, it didn’t restrain them either. This is not a small or trivial reflection, as the whole point of controlling the liquidity rate was to not just “stimulate” but also to restrict where “necessary.” To say that there was no limitation upon the eurodollar advance is an understatement since banks simply wrote their own, to the point that they even manufactured their own currency (collateral) far outside of what these economists considered to be well-aligned financial behavior.
The relevant point to consider for stocks is which trend is closer to the “truth” of asset inflation. That is, of course, amplified in 2015 by the revisiting of eurodollar decay in much more strained and openly chaotic fashion. If the “dollar” is again to fail, what might that do to stocks? While that isn’t knowable we do have some methods of gaining insight, for which only certain central bankers will provide useful perspective.