
The Commerce Department reported that the seasonally adjusted headline number for Retail Sales rose in May by an estimated 0.5%. That figure will be revised multiple times in the months and years ahead as more data comes in and the seasonal adjustment factor is repeatedly revised until its curve reasonably approximates the actual data. In the game of Pin the Tail on The Number, Wall Street economists undershot, coming in with a consensus guess of +0.3%. The reported number was a “beat” in that regard.
The actual, not seasonally adjusted number rose by $20.5 billion or 4.5% from April. The best way to tell if that’s a good number or not is to compare it with May’s performance last year. May of 2015 saw a month to month gain of $27.4 billion or 6.1%. Compared to last year, this year fell short.
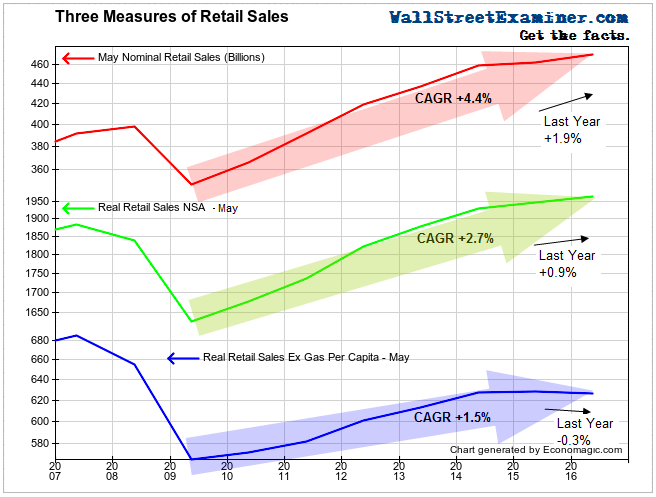
The year to year gain this May was 1.9%, which is also not too impressive, especially considering that the headline number is not adjusted for inflation. Deflating the Census Bureau’s nominal retail sales data, which the mainstream media dutifully regurgitates, results in only a slightly more realistic figure. Deflating by CPI, which has a long term record of understating actual inflation, CPI adjusted “real” retail sales rose by 0.9% year to year. That number got some help from a brief period of falling CPI, thanks to weak gasoline prices in 2015.
To get a picture of how sales are going without the distortion of wildly volatile gas prices and the swings in gasoline sales that result from that, we can look at real retail sales excluding gas. A more accurate deflator for this figure would be the retailers’ cost as shown by the PPI for finished retail goods. To get an idea of how much the average consumer is actually purchasing, each month we can divide by population. By this measure, the unit volume of sales per capita fell by 0.9% year over year after being virtually flat the year before.
Click here to view chart if reading in email.
This data demonstrates that too many Americans no longer have sufficient income to increase their retail spending. In fact, on a per capita basis, the typical American consumer is purchasing 12.5% less than he or she was in 2007. If this trend of zero or negative growth doesn’t reverse, eventually total retail sales will follow.
For most Americans, there has been no recovery. The spoils of QE and ZIRP have not flowed to them. As the benefits of ZIRP accrue only to those at the top of the economic pile, the foundation of the US economy is slowly but surely being eroded.

