
Monetary central planning is failing to achieve Keynesian “escape velocity” because it has deeply impaired the engines of capitalist enterprise. Nowhere is this more apparent than in the grotesque financialization of American business that has occurred since the 1980s. As usual, this deformation is rooted in the massive growth of debt carried by non-financial businesses.
As shown below, non-financial business debt (corporate and non-corporate) has increased by nearly 8X since 1982 or at almost double the growth rate of GDP. Accordingly, the ratio of total business debt to GDP has risen from 53% to 81% over the last 32 years.
Needless to say, this debt tsunami was not devoted to investment in productive assets and therefore future growth and productivity. Especially since central bank money printing came to dominate the financial markets after the mid-1990s, the rate of real net business investment in the US economy has actually gone in the opposite direction—exhibiting an unprecedented decline. And in this context it is important to emphasize that the appropriate metric is net investment after current period consumption of capital is accounted for—- not gross CapEx as is measured in the GDP accounts and touted by Wall Street economists.
The latter measure is a Keynesian delusion based on “flow” economics. That is, the proposition that current quarter “spending” is all that counts because it helps to fill the bathtub of GDP closer to the rim of its purported full-employment potential.
But that ignores business cycle history and the productive structure of the economy. If a central bank induced financial bubble and bust has caused a deep economic slump, as it did in 2008-2009, and business investment has resultantly been sharply curtailed, that pull-back of current CapEx outlays does not stop the wear and tear on the business sector’s plant, equipment and other tools of production. Accordingly, during the recovery up-turn gross CapEx needs to compensate for recession shortfalls in capital replacement, as well as current period depreciation.
By contrast, when nominal CapEx does not cover accumulated depreciation—then the economy’s seed corn is being consumed. What results is a circumstance in which the headline readers on bubblevision breathlessly report a quarterly uptick in fixed business investment, but remain clueless to the possibility that it actually measures an erosion of productive capacity after accounting for deprecation, amortization and the inflation gap between current replacement prices for capital assets and their historic accounting basis.
In fact, that is exactly what has been happening since 1998. The modest recovery of business CapEx in each upturn has not been sufficient to cover cumulative capital consumption plus an increment for capacity growth. Accordingly, the trend level of real business investment spending has been heading south for the last 17 years, and now stands 20% below its turn of the century levels.
There can be no mystery, therefore, as to how the American business sector has deployed its vast accumulation of debt. It has overwhelmingly gone into financial engineering—that is, into the strip-mining of equity from the business sector by means of stock buybacks, LBOs and cash M&A takeovers. By definition, these maneuvers confer windfalls on equity holders, but add nothing to productive capacity.
During the years since the December 2007 pre-crisis peak, this trend has been especially apparent. Non-financial business debt outstanding has soared from $11 trillion to $14 trillion or by nearly 30%. Yet, as is evident in the chart above, real net investment is still well below its 2007 level. Indeed, even gross business investment in plant and equipment is 5% below its prior peak.
By contrast, stock buybacks and M&A volumes have come roaring back. The former is now up by 5X from the 2009 bottom and is approaching its 2007 blow-off level.
Debt fueled M&A deals are also back at levels which resulted in massive restructurings and jobs cuts when the macro-economy turned down in 2008-2009. The potential for a reoccurrence is evident in the data for leveraged loans.
Obviously, neither GDP nor business value added has grown at anything like these rates during the last 30 years. As measured as a share of GDP, for example, the TEV of non-financial corporations has soared from 70% to 170% of GDP since 1982.
It goes without saying that this trend embodies a destructive cycle of financialization. Rather than functioning as a dynamic engine of growth in productivity, enterprise and real wealth, the American business sector has become a tool of economic redistribution. Taking on more and more debt, the business sector cycles cash to Wall Street and the top 10% of households which hold most of the corporate equities.
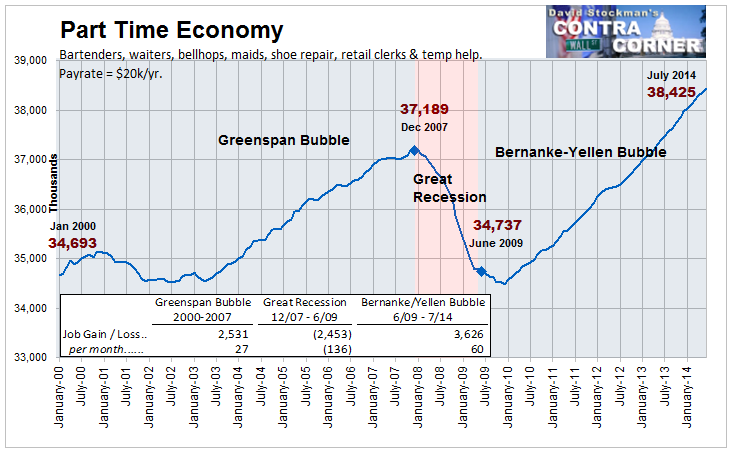
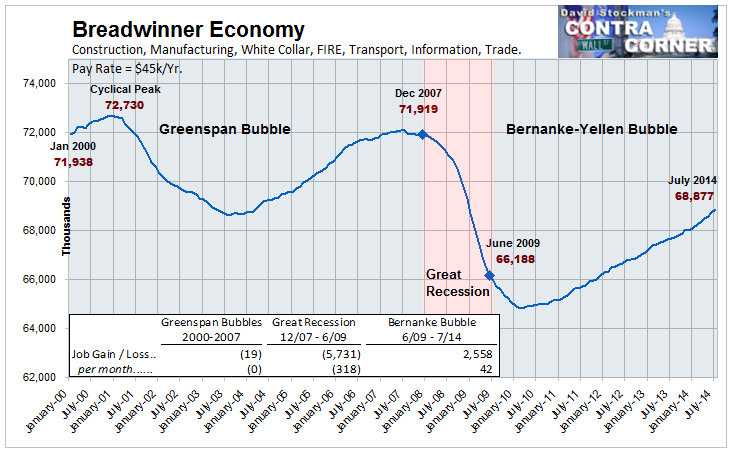
Needless to say, this on-going plunder of business balance sheets goes hand-in-hand with the collapse of “breadwinner” jobs in the American economy. Once again, the July jobs report’s headlines touted another month of robust job creation. But as has been the case for the past 14 years, this headline job growth has been overwhelmingly concentrated in marginal part time jobs catering to the spending habits of the affluent upper strata. By contrast, owing to the lack of real investment in productive enterprise, the count of breadwinner jobs still remains 5% below its level when Bill Clinton was still in the oval office.
At the end of the day, there is no mystery as to why trend GDP growth has fallen to just 1.8% per annum since the year 2000—-a rate which is barely half its trend during the previous half-century. Monetary central planning inherently deforms market capitalism by flooding the business sector with cheap debt, thereby turning it into an engine for the redistribution of existing wealth rather than the generation of new growth, jobs and enterprise.

