
Today will go down in history as one of the worst times in history to be invested in the stock market. Virtually no one believes this statement. That is why it will prove to be true. Every valuation method known to mankind is flashing red. A crash is baked in the cake. Will the trigger be Greek default, a Chinese market crash, a Fed rate increase, a derivative bet going boom, a Middle East event, someone doing something stupid in the South China Sea, a Ukrainian eruption, or a butterfly flapping its wings? When greed turns to fear, for whatever reason, the house of cards will collapse for the 3rd time in 15 years. Thank the “brilliant” bankers at the Federal Reserve.
I’ve picked out the most important passages from Hussman’s weekly letter for your enjoyment.
The financial markets are establishing an extreme that we expect investors will remember for the remainder of history, joining other memorable peers that include 1906, 1929, 1937, 1966, 1972, 2000 and 2007. The failure to recognize this moment as historic is largely because investors have been urged to believe things that aren’t true, have never been true, and can be demonstrated to be untrue across a century of history. The broad market has been in an extended distribution process for nearly a year (during which the NYSE Composite has gone nowhere) yet every marginal high or brief market burst seems infinitely important from a short-sighted perspective. Like other major peaks throughout history, we expect that these minor details will be forgotten within the sheer scope of what follows. And like other historical extremes, the beliefs that enable them are widely embraced as common knowledge, though there is always, always, some wrinkle that makes “this time” seem different. That is why history only rhymes. But in its broad refrain, this time is not different.
More enlightened leaders at the Federal Reserve would never have allowed, much less intentionally encouraged, yet the third speculative episode in 15 years. Unfortunately, the idea that repeated cycles of malinvestment and yield-seeking speculation have actually been thecause of the nation’s economic malaise doesn’t seem to cross their minds.
Moreover, consumers spend based on their concept of “permanent income,” not off the value of volatile assets such as stocks. Economists have understood this since the 1950’s. While the Fed has been successful at intentionally promoting yield-seeking speculation since 2009, a century of evidence demonstrates that current valuation extremes also imply a market collapse that is now baked in the cake, and that Federal Reserve policy has much less ability to prevent than investors seem to believe.
We’ve seen various criticisms based on the misconception that the concerns of value investors such as Jeremy Grantham and I rest simplistically on the Shiller P/E. Those criticisms are coupled with ad hominem criticisms that I’ve repeatedly addressed ad nauseum. All of this might carry more weight if better valuation measures than the Shiller P/E did not also have even worse implications for future market returns. Numerous historically reliable measures, based on earnings, revenues, assets, gross value added, and other fundamentals all line up with a similar message. The following chart fromDoug Short provides a very nice long-term perspective based on Tobin’s Q (market capitalization / corporate net worth) going back to 1900.
If one draws any lesson from the above chart, it should be a full understanding of exactly how poor market returns were, and for how long, following similar historical extremes.
January 1906: Following an initial plunge into July of 1906, the market would recover, and then collapse in what was known as the “panic of 1907,” losing half of its value by the end of that decline. More importantly, however, the Dow Jones Industrial Average would not durably move beyond its 1906 peak until April 1938, more than three decades later.
September 1929: Following the initial 1929 crash, the market would briefly rebound by about 50% into early 1930, collapsing again as the Great Depression took hold. From its September 1929 peak of 381.17, the Dow Jones Industrial Average would collapse to 41.22 at its 1932 low, losing 89% of its value. The Dow would not durably move beyond its 1929 high until November 1954.
August 1937: One of the repeated fallacies of historical perspective currently making its way among analysts is the notion that the Federal Reserve raised interest rates prematurely in 1937, cutting short the recovery from the Great Depression and causing stocks to crash. There are several problems with this narrative. The first is that the Fed did not raise interest rates at all. Indeed, the Fed discount rate was progressively lowered until it reached 1.0% in September 1937, and the first rate hike would not occur until 1948. The Fed did raise reserve requirements in 1936, but at a time when actual reserves were already more than 200% of required reserves. What actually happened in 1937 was that an already fragile financial bubble crashed. Market internals, on our measures, turned negative in May 1937, before the market actually peaked. Following the August high, the stock market went on to lose half of its value by early 1938. In short, a market collapse was already baked in the cake on the basis of extreme valuations, and the subsequent collapse was clearly preceded by a shift toward investor risk aversion.
We have no argument with the idea that the increase in reserve requirements and a modest decline in the monetary base, regardless of actual economic impact, might have contributed to that shift toward risk aversion and the timing of the crash. But again, a crash was already baked in the cake. It was the coupling of extreme valuations with increased risk-aversion – regardless of its origin – that explains the 1937 crash in a context that is fully consistent with more than a century of market history.The Dow Industrials would not durably exceed the August 1937 market peak until November 1949.
February 1966: Following an initial bear market that year, the stock market would enter a series bull-bear market cycles, each ending at progressively lower levels of valuation for the next 18 years. That sequence is what defines a “secular” bear market. The S&P 500 would set its August 1982 low within 10% of that February 1966 peak.
January 1973: This point is included not because it was the most extreme valuation, but because it was the highest point in terms of price during the early years of the 1966-1982 secular bear market. At the 1973 peak, the S&P 500 Index was only 16% above its Feburary 1966 level. The market would go on to lose half of its value by late-1974. The S&P 500 would not durably clear its January 1973 peak until September 1982.
March 2000: We already know that the first collapse from the 2000 peak would take the S&P 500 down by half, and the Nasdaq 100 down by 83%. It also wiped out the entire total return of the S&P 500 – in excess of Treasury bill returns – all the way back to May 1996. Notably, the Federal Reserve was aggressively and persistently lowering interest rates throughout the collapse. It is only the return to obscene historical overvaluation that has even allowed the S&P 500 to post a 4% annual total return over the past 15 years. I expect that every bit of that total return will prove to be transitory by the completion of the current market cycle.
October 2007: We already know that the collapse from the 2007 would take the S&P 500 down by 55%. It also wiped out the entire total return of the S&P 500 – in excess of Treasury bills – all the way back to June 1995. Notably, the Federal Reserve began cutting interest rates a month before the 2007 market peak, and continued to cut interest rates persistently throughout the collapse.
As a reminder of how “following the Fed” treated investors during the collapse of the most recent market extremes, the chart below shows the Federal Funds rate alongside the S&P 500 during those declines.
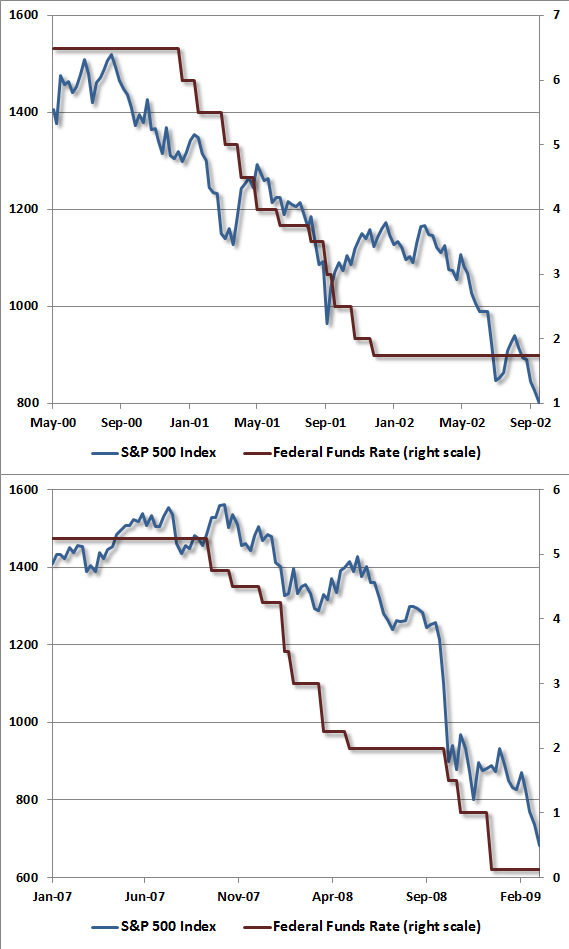
I know. Investors don’t want to believe this. They want to believe that the Federal Reserve has their backs; that as long as the Fed doesn’t explicitly hike interest rates, the market will move higher indefinitely.
Put simply, investors whose strategy is to follow the Fed – in the belief that stocks will advance as long as the Fed does not raise interest rates – are free to place all their eggs in Janet’s basket. On the other hand, for investors whose strategy is historically informed by factors that have reliably distinguished market advances from collapses over a century of history, our suggestion is to consider a stronger defense. Our greatest successes have been when our investment outlook was aligned with valuations and market internals, and our greatest disappointments have been when it was not. Both factors are unfavorable at present, and our outlook is aligned accordingly.

