
Another Measure Of Overvaluation
My friend and colleague, Doug Short, regularly posts updates on multiple levels of valuation on the market. To wit:
“Here is a summary of the four market valuation indicators we update on a monthly basis.
- The Crestmont Research P/E Ratio (more)
- The cyclical P/E ratio using the trailing 10-year earnings as the divisor (more)
- The Q Ratio, which is the total price of the market divided by its replacement cost (more)
- The relationship of the S&P Composite price to a regression trendline (more)
To facilitate comparisons, we’ve adjusted the two P/E ratios and Q Ratio to their arithmetic means and the inflation-adjusted S&P Composite to its exponential regression. Thus the percentages on the vertical axis show the over/undervaluation as a percent above mean value, which we’re using as a surrogate for fair value. Based on the latest S&P 500 monthly data, the market is overvalued somewhere in the range of 43% to 90%, depending on the indicator, up slightly from the previous month’s 42% to 89%.“

However, it is not just these more standard levels of excess valuation that currently exist but also other more non-standard measures as well such as the price-to-sales ratio as recently analyzed by contributing partner Michael Lebowitz of 720 Global Research:
“As shown in the bottom graph, the P/S ratio is now 2.50 standard deviations from the median and well above the prior levels preceding the significant bear markets of 2000-2002 and 2007-2009.”
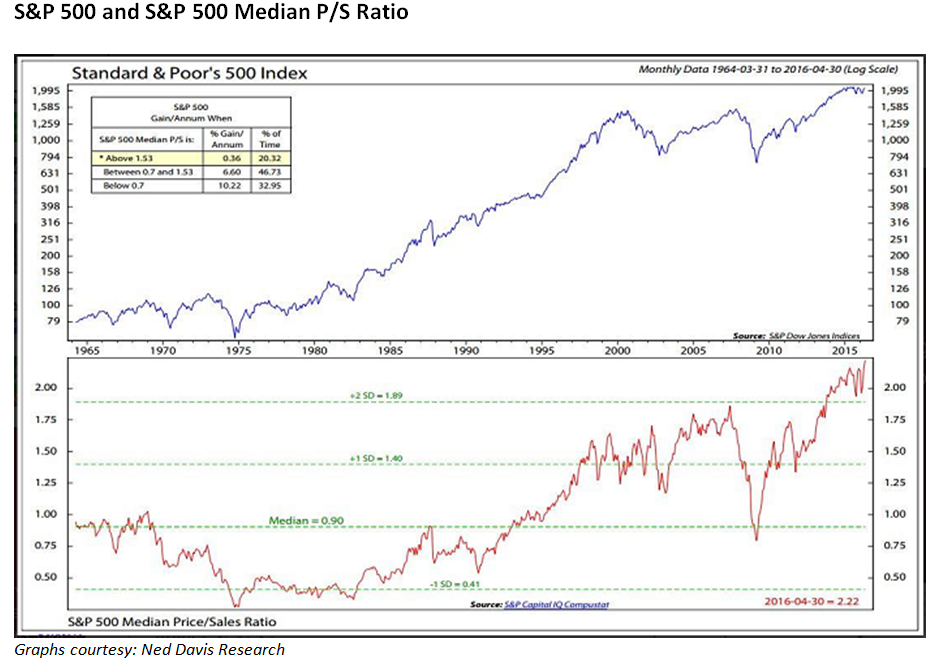
“Based on the fact that the P/S ratio has been steadily rising and has eclipsed prior peaks, we are left to select from one of two conclusions as we mentioned previously:
- that investors are extremely optimistic about the potential for revenue growth, or;
- investors are once again caught in the grasp of bubble mentality and willing to pay huge premiums to avoid missing out on further gains.”
Which brings me to price-to-book.
The P/B ratio reflects the value that investors attach to a company’s equity relative to its book value of equity. The book value of equity is an accounting measure that is based on the historic cost principle, and reflects past issuances of equity, augmented by any profits or losses, and reduced by dividends and share buybacks. The chart below compares the overall price-to-book value of the S&P 500 to the index itself.
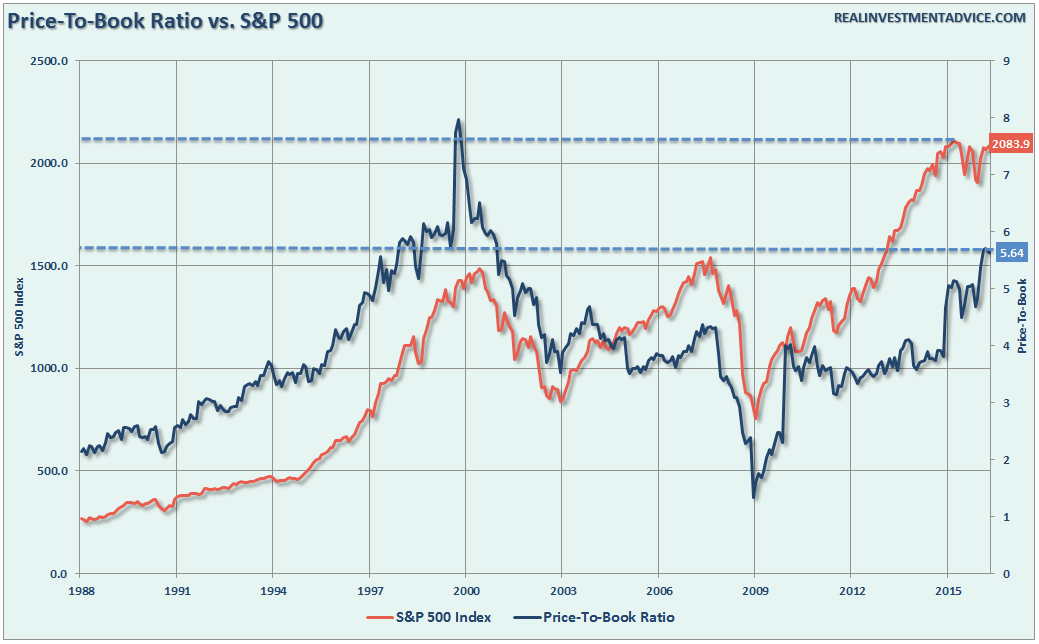
Currently, investors are paying a premium of 5.64 times the book value of the index which is the second highest level on record. While valuation measures are not a great “market timing indicator” there are useful in determining forward return expectations from the index.
Unfortunately, as is always the case during late stage market advances and market topping processes, measures of valuation are dismissed and/or diminished by measures to explain why “this time is different.” Unfortunately, this has never been the case, and will likely not be the case this time either.
In the end, it is simply this:
“The value you pay today for an investment is directly correlated to the value you receive in the future.”
For most investors today who are planning on annualized 8% returns over the next 20-years, the biggest increase will be in the level of disappointment in what is actually received.
Dividends Send A Warning
I recently discussed the issue of rising corporate debt levels to fund share repurchases:
“Corporate debt is a hot topic this year. Before the 2008–09 calamity, U.S. non-financial corporate debt teetered at $2.6 trillion dollars. It is now $5.8 trillion. The reported $2 trillion of corporate ‘cash on the balance sheet’ constitutes only 30–35% of the corporate debt. So much for that meme. ”
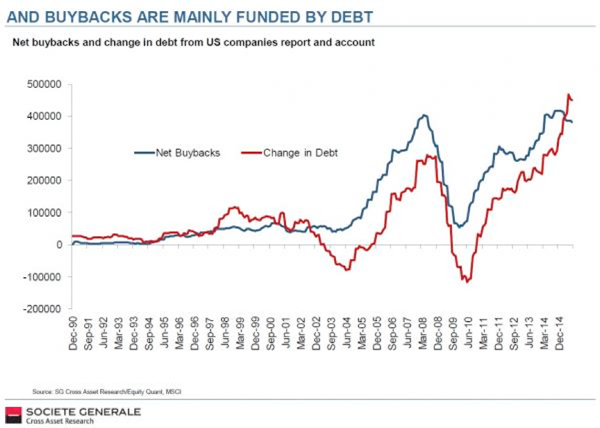
“So what’s all this debt being used to fund? Share buybacks, of course. More is spent on share buybacks than on capital expenditures (Capex). Companies are making corn dogs from their seed corn. The record buying spree is twice that of the early months of 2014.
Citi analysts noted that ‘if leverage is going up today because it’s funding tomorrow’s growth that might not be a bad thing. Unfortunately, that’s not what’s going on.’ Companies reaching for returns on their cash have found another overpriced investment on which to squander their shareholders’ value—other companies’ bonds. The sellers of these corporate bonds are reputed to be using the proceeds to . . . wait for it . . . buy back shares of their companies! This is financial engineering that would make Escher proud.”
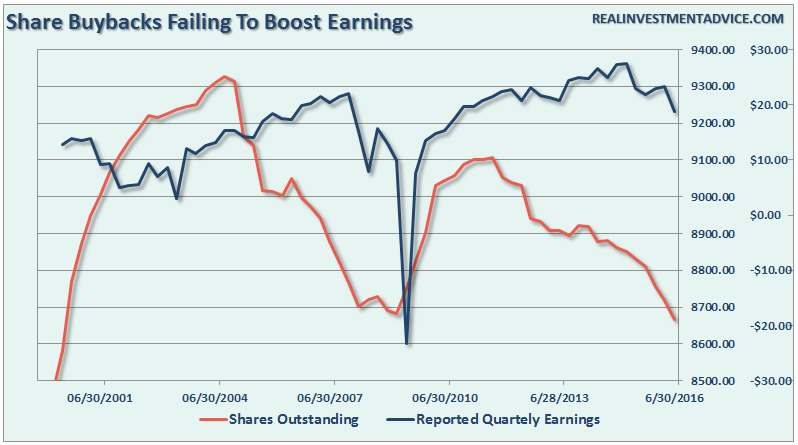
But the problem currently is despite the rampant increase in share buybacks, earnings are no longer growing.
However, companies are not just borrowing to complete share buybacks but also to issue out dividends. According to the most recent S&P 500 company filings, the level of cash dividends per share have now reached $11.28 which is near the peak level of $11.35 at the end of 2015.
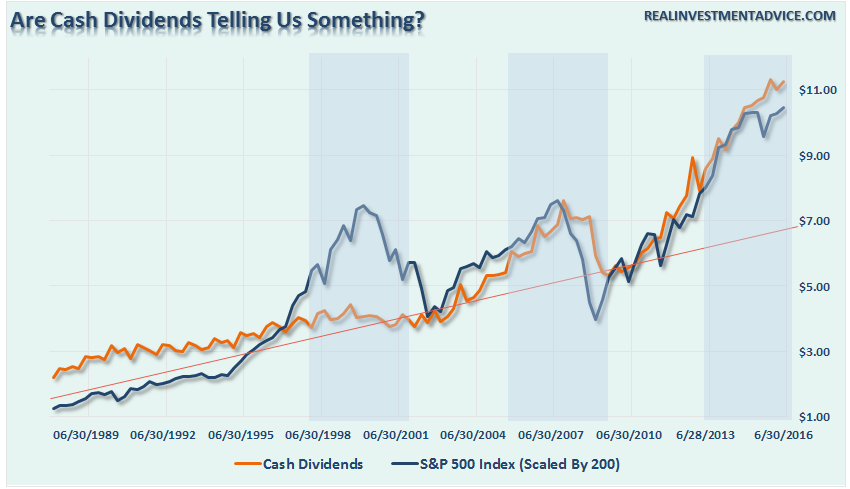
It is also the greatest deviation from the long-term trend of dividends per share since the financial crisis (highlighted in blue.)
The reality is that share buybacks create an illusion of profitability and increases in dividends continue to support the “chase for yield.”
However, the problem is that both of these means of boosting asset prices are “finite” in nature and eventually the “devil will be paid his due.”
2100 – It’s Now Or Never
Brexit? What Brexit? If you gauge by the markets, whatever concerns there might have been about the British referendum to leave the EU has been dismissed as the markets have entirely erased what was to be the “end of the world as knew it.” (Apologies to R.E.M.)
This recovery, as expected, was driven by the quick actions of global Central Banks to run to the rescue. The chart is getting so cluttered with announcements I am running out of room to keep them all listed.
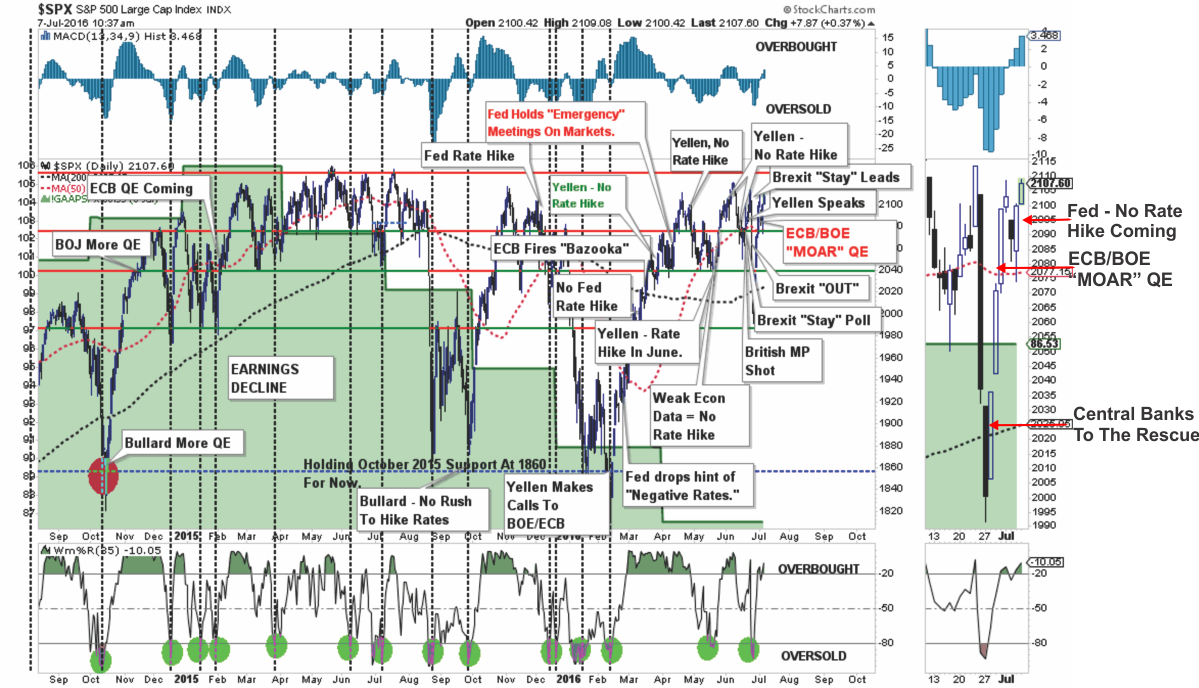
For the “bulls” there is a bit of support here for a breakout above 2100 and a push back towards the old highs of 2135. With the focus of the markets putting the “Brexit” in the rear-view mirror, for now, attention is turning back towards the domestic economic backdrop. The “timing” is good.
Over the last several months, as shown in the Economic Output Composite Index (EOCI) index below as compared to both GDP and the Leading Economic Indicator Index, we see the decline in economic activity has reached levels where a bounce in the data from restocking activity would be expected. (The EOCI is comprised of the CFNAI, Chicago PMI, LEI, NFIB, ISM, and Fed regional surveys.)
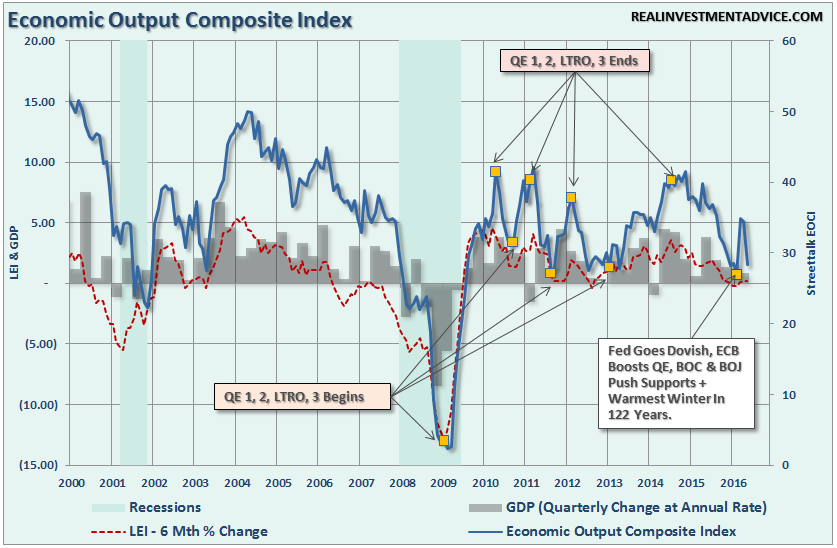
With the recent bounce in both the ISM Manufacturing & Services reports, the “bulls” will once again focus on an “improving” economy and hopes for an earnings recovery in second half of the year. Unfortunately, these hopes will be disappointed as the drag from global weakness and the end of a restocking cycle quickly conclude.
However, from a short-term technical perspective, the push of 2100 is very likely particularly if the employment report on Friday shows even modest improvement. However, a failure to maintain the levels above 2100 through the end of next week, particularly given the current overbought conditions as shown below, will likely see a return to the 2040-2100 trading range we have been caught in over the last several months.
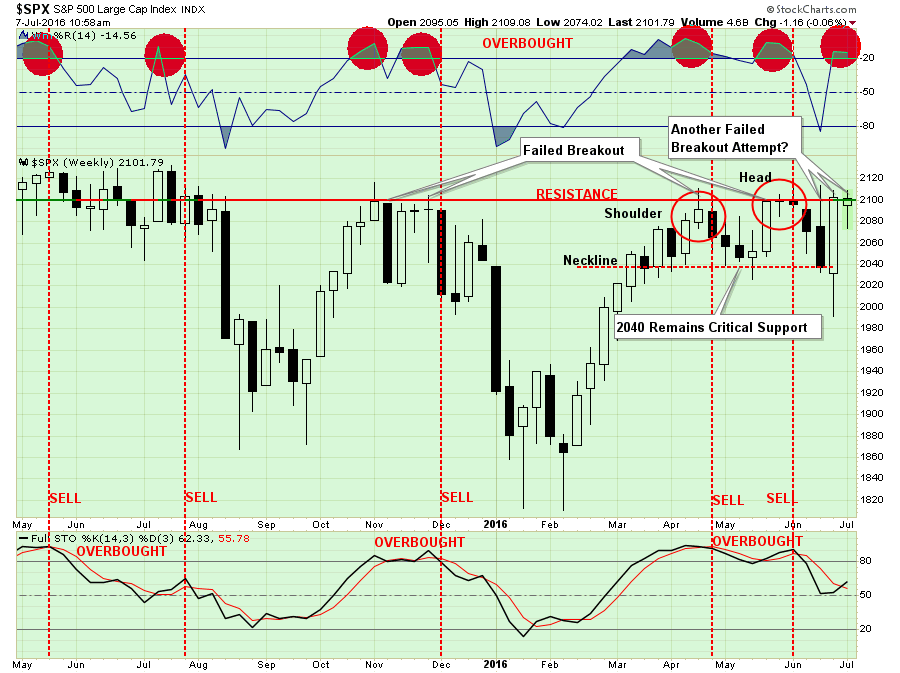
Importantly, this short-term analysis does not nullify the long-term view of the risk currently residing in the financial markets. My expectation is that August and September remain high-probabilities for a retest of the February lows as concerns over the election heat up.
But then again, it really is all about the Fed. Right?
Just some things to think about.
Lance Roberts

Lance Roberts is a Chief Portfolio Strategist/Economist for Clarity Financial. He is also the host of “The Lance Roberts Show” and Chief Editor of the “Real Investment Advice” website and author of “Real Investment Daily” blog and “Real Investment Report“. Follow Lance on Facebook, Twitter, and Linked-In

