
Perhaps the most animating aspect of bubble complaints is how much the highest risk pieces are exhibiting the lowest risk tendencies. Nowhere is that more evident than leveraged lending, the bank-led syndication of what would otherwise be termed junk. In this repressed environment, anything offering the slightest elevation in return is prized by those starved for it – which is pretty much everyone now. And, as it so happens with bubbles in this variety, return becomes more than one aspect of financial features.
In the case of junk of whatever final form, there is more than just the “reach for yield” as the FOMC deigned to actually term it, as eventually that process is “enhanced” and then finally circumvented by momentum and price “investors.” At that point, it is impossible to see where “reach for yield” ends and total and exhaustively pure price speculation begins. The ends of bubbles see the search for price appreciation and inflation, driven by momentum, more than any steady stream of elevated income, risky or not.
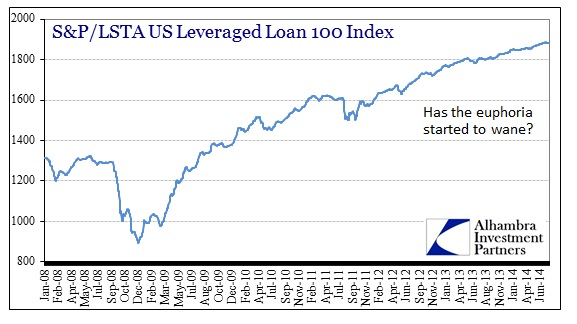
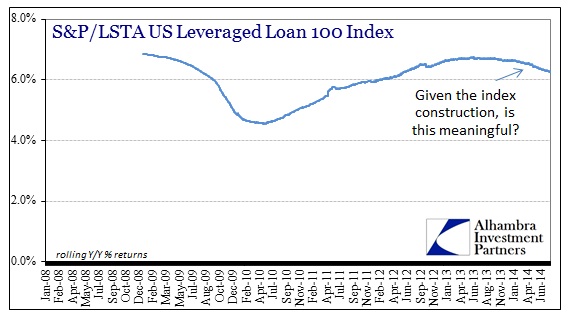
I think that has characterized leveraged loans, at least as reconstructed by the S&P/LSTA Leveraged Loan 100. The index kindly breaks down returns based on income and returns based on price movements, so we can measure the effects of both and make some rough and raw determinations. In terms of volatility, there is essentially none of it in the price segment. What looks like a straightening line in the chart immediately above is nearly exactly that:

The standard deviation of just the market value returns has dropped so low as to be eerily uniform. Again, on the market value side alone, that would seem to confirm the idea of a one-way market.
However, there are the Fed’s fingerprints to consider here. There was a clear demarcation at the operational conception of QE3 that is too coincidental to be pure coincidence. Average deal size in leveraged loans, at least as shown by the index, had been decidedly declining prior to the first October 2013 MBS settlements in TBA. Afterward, deal size headed back upward, eventually reaching what we saw toward the end of the last cycle before the panic in 2008.

So far during the taper regime, there hasn’t been any noticeable retracement or second thoughts about this junk credit. But it is at least interesting that the possibility of slowing price momentum has been introduced, dating itself right to the first instances of QE tapering.
Given the opacity of leveraged lending itself and the limitations to constructing an index to be representative of the entire space, there are no clear interpretations to be made from any of this, just some innuendo and beginning threads to possibly coherent theories. All this simply raises possibilities of an inflection requiring further confirmation and study.
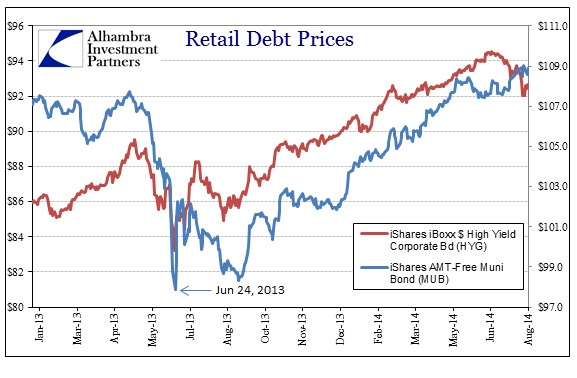
The parallel market to leveraged lending, junk bonds, saw very little impact of QE taper this year (which flips, somewhat, the relationship of last year – as junk bonds sold hard in the taper rumor period, while leveraged lending appeared wholly unaffected). Since June 25, high yield debt, as represented by the HYG ETF, has begun a significant decline that has been, thus far, unmatched by other retail credit segments – such as munis shown here with MUB:
It may not seem like very much, but at about 2% this most recent retrenchment is very close to the scale of the first leg of selling eruption in May 2013 after Bernanke’s taper introduction.
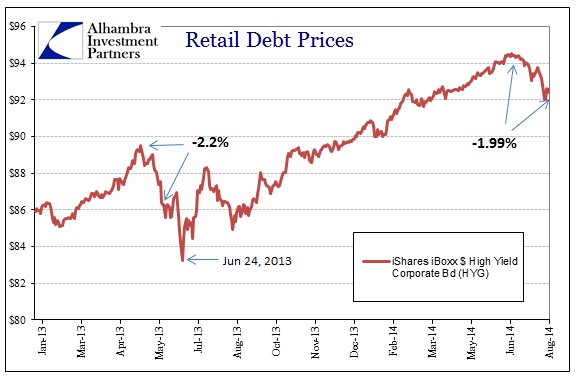
What’s truly curious, and perhaps most significant as my colleague Joe Calhoun points out, correctly, is that the interest rate environment now is fully inverted to last year’s episode. Here, the yield curve is flattening and in general interest rates of any longer than 2 years are dropping; whereas last year in the intense and amplified selling of a drained credit system interest rates were universally rising and yield curves dramatically steepening. The latter is the classic setup against any interest rate sensitive “product” or security; the current framing is not and thus suggests something different.
To confirm that further interpretation, the behavior of the different classifications of REIT’s seemingly agree.
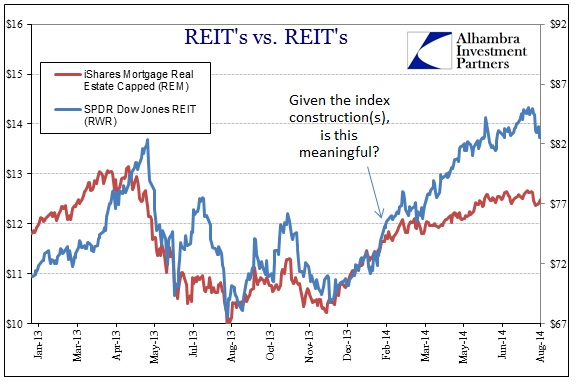
Equity and hybrid REIT’s have had little trouble re-asserting last year’s mania-like strength in demand, and thus price. Mortgage REIT’s, which are far more sensitive to deeper financial factors and considerations, remain still-below the prior peak (though have enjoyed a runup as well). What is potentially meaningful in this regard is the possible divergence in REIT classes right around February – which is the same period as so many other markets went “dark.”
As I stated before, I don’t think there are any definitive interpretations to be derived here, far too much conjecture and circumstantial posturing to be more confident. But I do think the cumulative effect of all these potential indications is of a credit market feeling its age, as 2013’s clear and monolithic drive (bubble?) has given way to more fragmented appearances, and thus somewhat different concerns (or, as the case may be, the actual occurrence of concerns beyond Fed policy and interest rates).
Part of this fragmentation might be related to end-cycle issues, as suspiciously low default rates demonstrate not economic rebirth but the confluence of all these bubble factors acting pro-cyclically to prolong economic “expansion” well beyond where it “should” end. From Fitch a little more than a week ago:
There have been 10 LBO related bond defaults thus far in 2014, compared with nine for all of 2013. The failed LBOs affected $21.8 billion in bonds this year and 26% of all bond defaults since 2008. Caesars would bring the latter tally to 29%. In addition, a Caesars filing would follow two prior restructurings via distressed debt exchanges (DDEs). Since 2008, 24% of issuers engaged in DDEs have subsequently filed for bankruptcy.
That would seem to connect economic concerns with the bubble factors. Further, as is typical, this potential inflection is given a very benign interpretation as if it can easily be dismissed as unimportant. That may be the case here, but, again, the possibility is wide open that it is not.
Click here to sign up for our free weekly e-newsletter.
“Wealth preservation and accumulation through thoughtful investing.”
For information on Alhambra Investment Partners’ money management services and global portfolio approach to capital preservation, contact us at: jhudak@alhambrapartners.com

