
“
Given the markets were closed on Monday, the analysis from this past weekend’s missive did not change. The important takeaway from that analysis was:
“A couple of week’s ago I discussed the rather clear “head and shoulders” technical pattern that we developing in the market. These patterns often suggest deeper corrections if they complete by breaking neckline support. A “gray rhino”if there ever was one.
The good news is the rally this past week terminated that formation by breaking the very short-term downtrend line as shown below.”
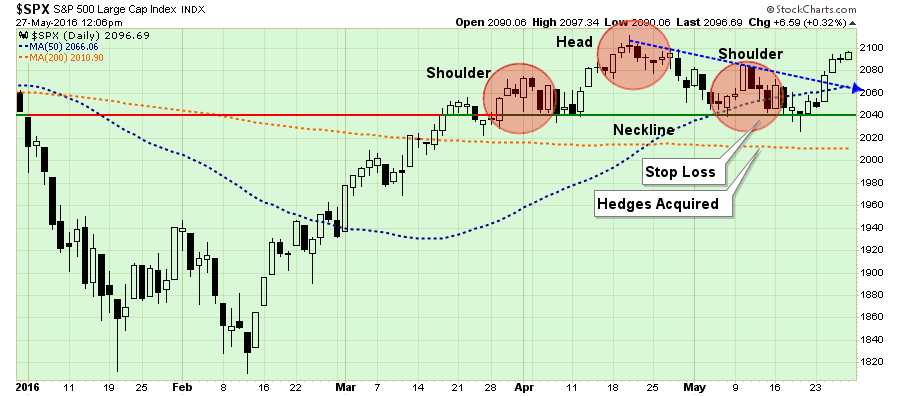
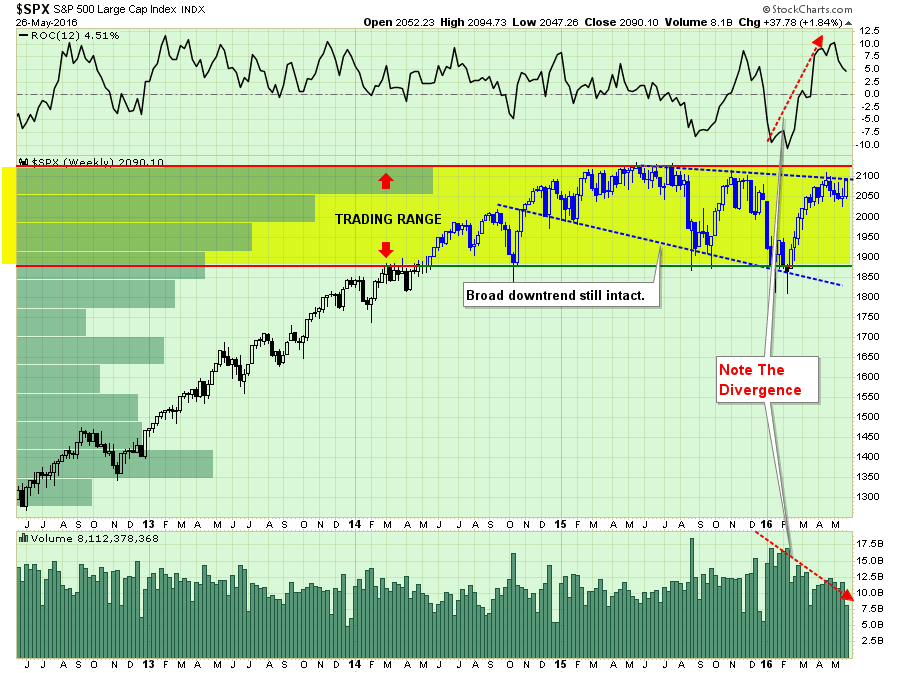
“While the market did nullify the more bearish short-term pattern, it is important to note that the market has not done much more than that.
All that really happened last week, as shown in the chart below was an oversold bounce on deteriorating volume confined to an overall market downtrend.”
“This isn’t a rally that should embolden investors to take on more risk, but rather considering “selling into it” as we head into the seasonally weak period of the year.
But that’s just me.
One note though. The markets have not made a new high within the past year. What does history suggest happens next? 77% of the time it has evolved into a bear market.
On second thought, maybe that should be you too.”
If this “bull market” is going to have legs, it is imperative the markets break above 2100 this week and make a push toward all-time highs. A failure to do so will likely suggest a pull-back to recent support at 2040 as shown in the chart above.
Importantly, a break below 2040 will signal the onset of a broader summer correction that could very well see a retest of the lows of the trading range that began in 2014.
In other words, the risk/reward ratio is not ideal for investors as we head into the seasonally weak period of the year.
What Has The Fed Wrought
This coming weekend, I am giving a live presentation (click here to register) about the state of the economy and how to invest for a new Presidential cycle. As I was preparing my slide deck I began analyzing the expansion of the Federal Reserve balance sheet and its impacts on various parts of the economy. The results were quite eye-opening.
In the early part of summer in 2010, the first Quantitative Easing program by the Fed came to its end. The hope was that as the program ended the economy would be well on its way to a more sustainable recovery. Unfortunately, as the program concluded, so did the market and economic recovery.
By the end of summer, with the markets down and the economy teetering on slipping back into recession, then Fed Chairman Ben Bernanke launched the second QE program. The purpose of these programs were made very clear by Bernanke when he stated:
“Conventional monetary policy easing works by lowering market expectations for the future path of short-term interest rates, which, in turn, reduces the current level of longer-term interest rates and contributes to an easing in broader financial conditions. These changes, by reducing borrowing costs and raising asset prices, bolster household and business spending and thus increase economic activity.”
Well, we know for certain that ongoing Federal Reserve interventions have indeed boosted asset prices as shown below.
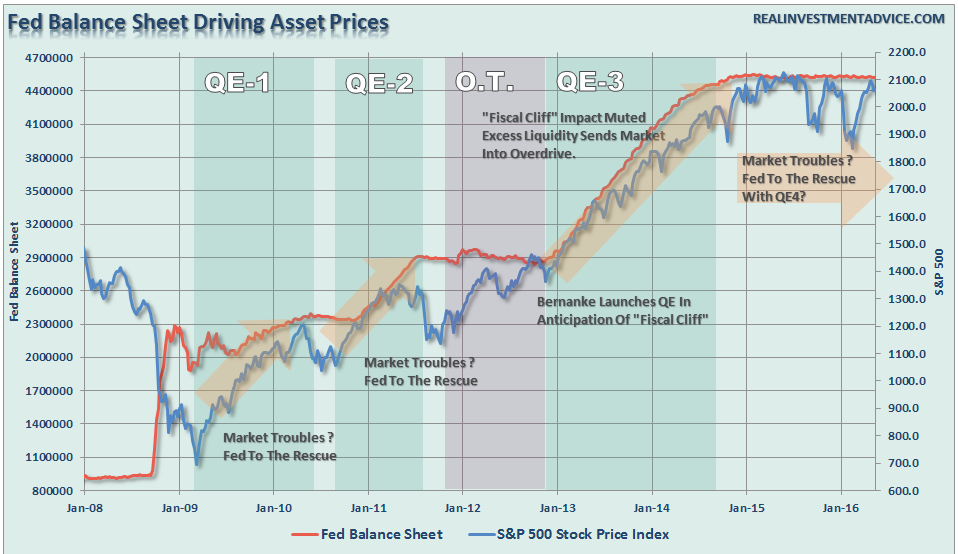
However, the question is did the elevation of asset prices actually translate into stronger economic growth. The answer is “yes” – each QE program was successful at pulling forward future consumption to provide a short-term boost to growth.
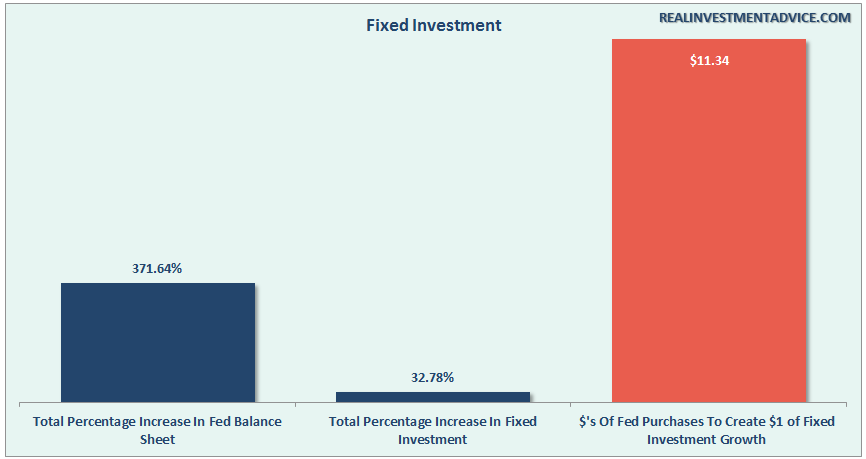
What I found interesting in my analysis, as shown in the charts below, was the effectiveness of QE on various parts of the economy. For comparison purposes, I have compared the total increase of the Fed’s balance sheet from 2009 to present to the percentage increase of each sector of the economy. I then derived from this analysis the total dollars of QE required to generate $1 of growth.
For example, it required $1.82 of QE for each $1 of increase in the S&P 500.
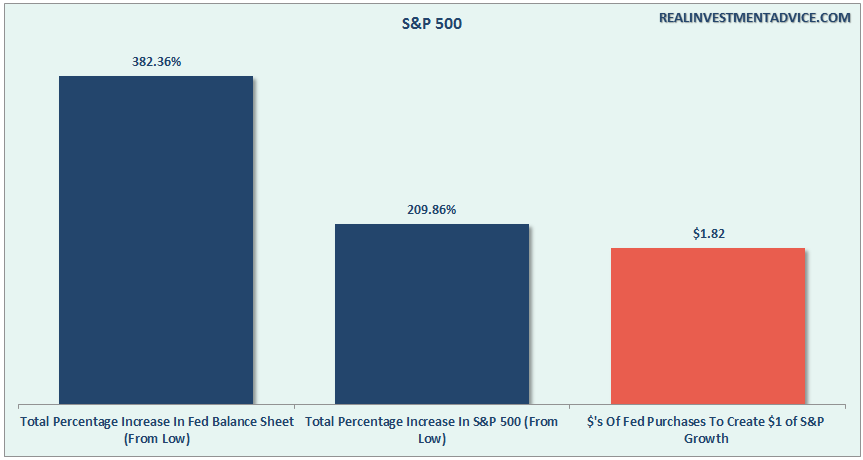
So, with this formula, we can take a look at the “effective cost” of QE on various parts of the economy.
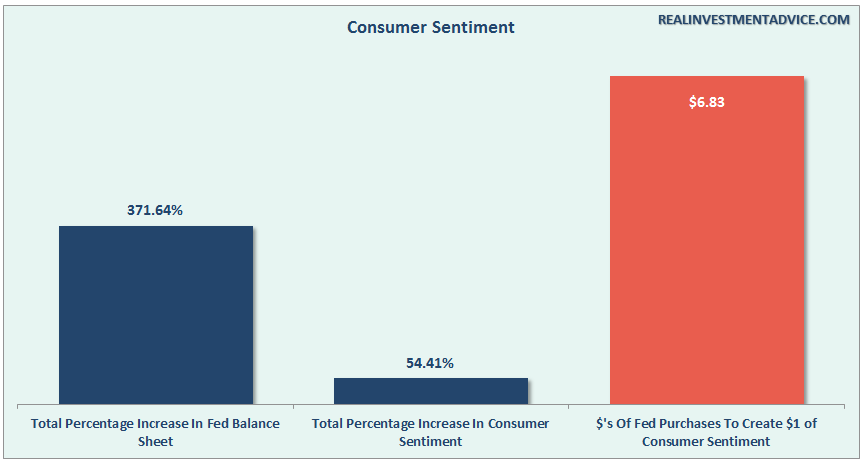
It required $6.83 to boost consumer sentiment.
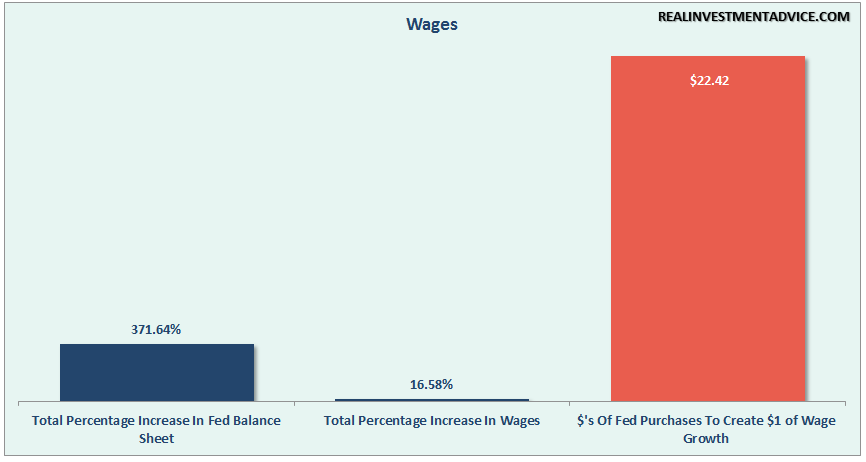
$22.42 for a very small increase in nominal hourly wages.
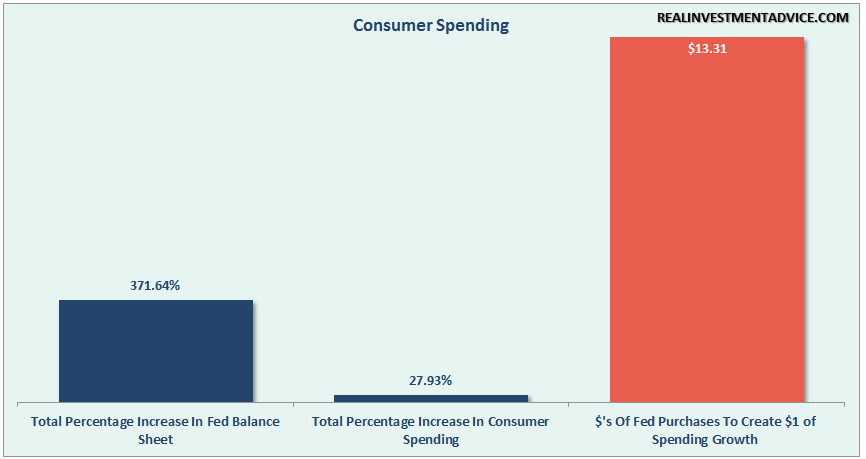
Consumer spending, the backbone of economic growth has increased by a total of 27.93% since 2009 at a cost of $13.31 of QE for every $1 increase in spending.
While companies are converting liquidity, high asset prices, and low interest rates to increase debt for M&A, stock buybacks, and dividends, little has translated into actual fixed investment. At $11.34 of QE to generate $1 of fixed investment, the transmission system is clearly weak.
The same goes for corporate profitability. $11.26 of QE for each $1 of corporate profits. It is actually substantially worse than that when compared to top line revenues which strips out share buybacks, accounting gimmicks, and other balance sheet chicanery.

While President Obama touts “the longest streak of employment growth since the 90’s,” it has come at the highest cost of growth of all at $47.16.
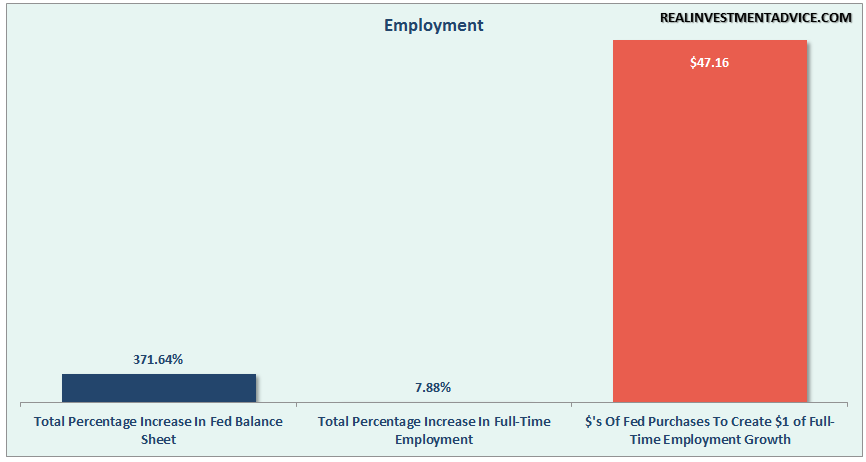
In fact, QE was actually much more cost effective at rolling individuals off of the employment rolls and shrinking the labor force by increasing those counted as “Not In Labor Force.” NILF has grown twice as fast and at half the cost of employment at just $22.83.

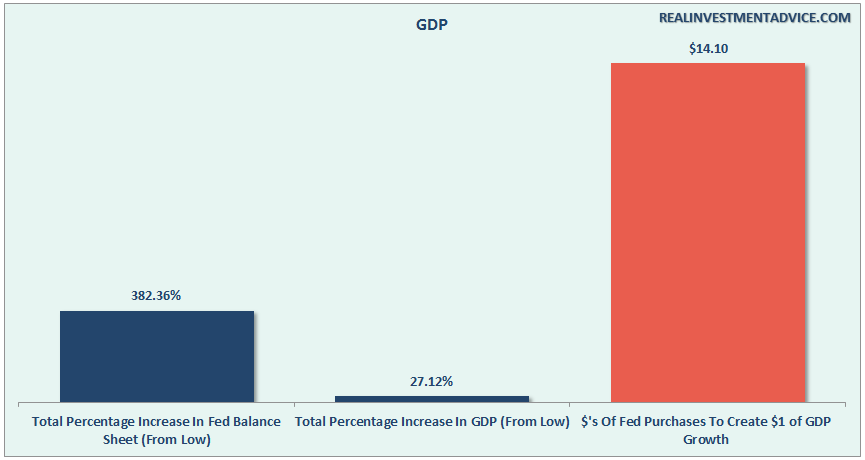
Of course, since each of these individual components are part of the broader economic landscape, how much QE did it require to boost overall economic growth? Just $14.10 of QE for each $1 of economic growth. What a deal?
Of course, with the Fed out of the QE game for now, and discussing tightening monetary policy further, the only question is whether “organic economic growth” has actually taken hold?
The Fed’s hope has always been that at some point they would be able to wean the economy off of life support and it would operate under its own strength. This would allow the Fed to raise interest rates back to more normalized levels and provide a policy tool to offset the next recession.
It has taken a massive amount of interventions by Central Banks to keep economies afloat globally over the last seven years and there is little evidence suggesting growth is accelerating. In fact, there may be more evidence suggesting quite the opposite.
With expectations rising the Fed will further tighten monetary policy in June, the lack of liquidity for the markets may become a much bigger issue not only for investors, but for the economy as a whole. In other words, excessive exuberance may have a high cost to pay.
“In investing, the man who wins is the man who loses the least.” – Dick Russell
Lance Roberts
Lance Roberts is a Chief Portfolio Strategist/Economist for Clarity Financial. He is also the host of “The Lance Roberts Show” and Chief Editor of the “Real Investment Advice” website and author of “Real Investment Daily” blog and “Real Investment Report“. Follow Lance on Facebook, Twitter, and Linked-In

