
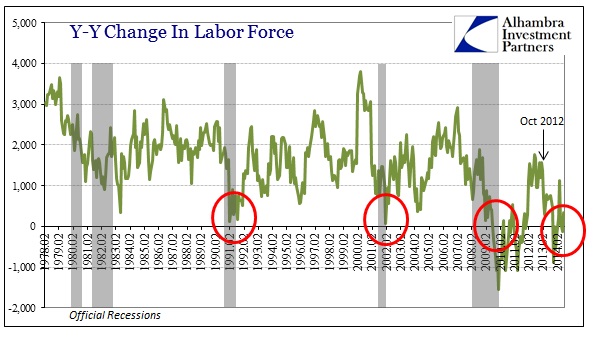
Despite any intent, the revisions to wages and real incomes that I highlighted yesterday actually go a long way toward providing an explanation for other “aberrations” that still exist. The primary problem I have with accepting the mainstream version of economic events, particularly that of the Establishment Survey, is that the labor force is still shrinking, or at least barely growing (dependent on where you start your point of comparison). That violates everything we know about economic function, down to its most intuitive level.
A robustly growing jobs market will undoubtedly, especially given the millions upon millions that are out of the labor force through no choice of their own, draw old as well as new participants into it. Even orthodox convention accepts as much given actual historical experience with actual recoveries. So the behavior of the labor force going back to 2012 is very much at odds with the stretch of payroll counts, including the Household Survey though it only shows about 69% of the job growth dating to October 2012.

However, if income growth was as negative as it appears in the revised figures, that would certainly offer a sensible and applicable explanation for why the labor force did not expand as it should have were the recovery narrative real. Negative income growth would, particularly on a per capita basis, be far more consistent with shrinking participation due to lack of actual wage progress no matter how you estimate the cursory beancount of the quantity of jobs or the number employed.
The timing for these moves, the deceleration of income growth, is preserved both before and after the income revisions, but the degree to which income growth changed, now shrunken so much, in 2013 is what is truly compelling. And, as I have documented numerous times before, that observation extends not just to the labor force but also household formation.

Furthermore, population estimates downshifted markedly in 2013 (which some offer as nothing more than a transparent excuse for both the labor force and household formation). In calculating real disposable personal income per capita, the fact that the denominator in the fraction was growing far less than the previous year should have “helped” the figure. With lower population growth but still negative per capita income growth that suggests something very wrong with economic flow and actual conditions.
Again, that would confirm the viewpoint of the labor force and household formation – if jobs aren’t plentiful, or paying much, you aren’t going to rejoin the labor force after several years out of it, nor are you going to move out of your parents’ basement. So even if the Establishment Survey is correct or nearly so, the lack of actual income beside that trend belies the notion of economic advance. A true recovery or healthy trend would not be so lacking as job growth would actually coincide with wage growth. You can only postulate “slack” as another rationalization for so long, and seven years is a long time.
As we head into the overexcited state about payroll gains tomorrow, this should more than emphasize that statistics aren’t very compelling in isolation (for both interpretation and even validity).
Click here to sign up for our free weekly e-newsletter.
“Wealth preservation and accumulation through thoughtful investing.”
For information on Alhambra Investment Partners’ money management services and global portfolio approach to capital preservation, contact us at: jhudak@alhambrapartners.com

